


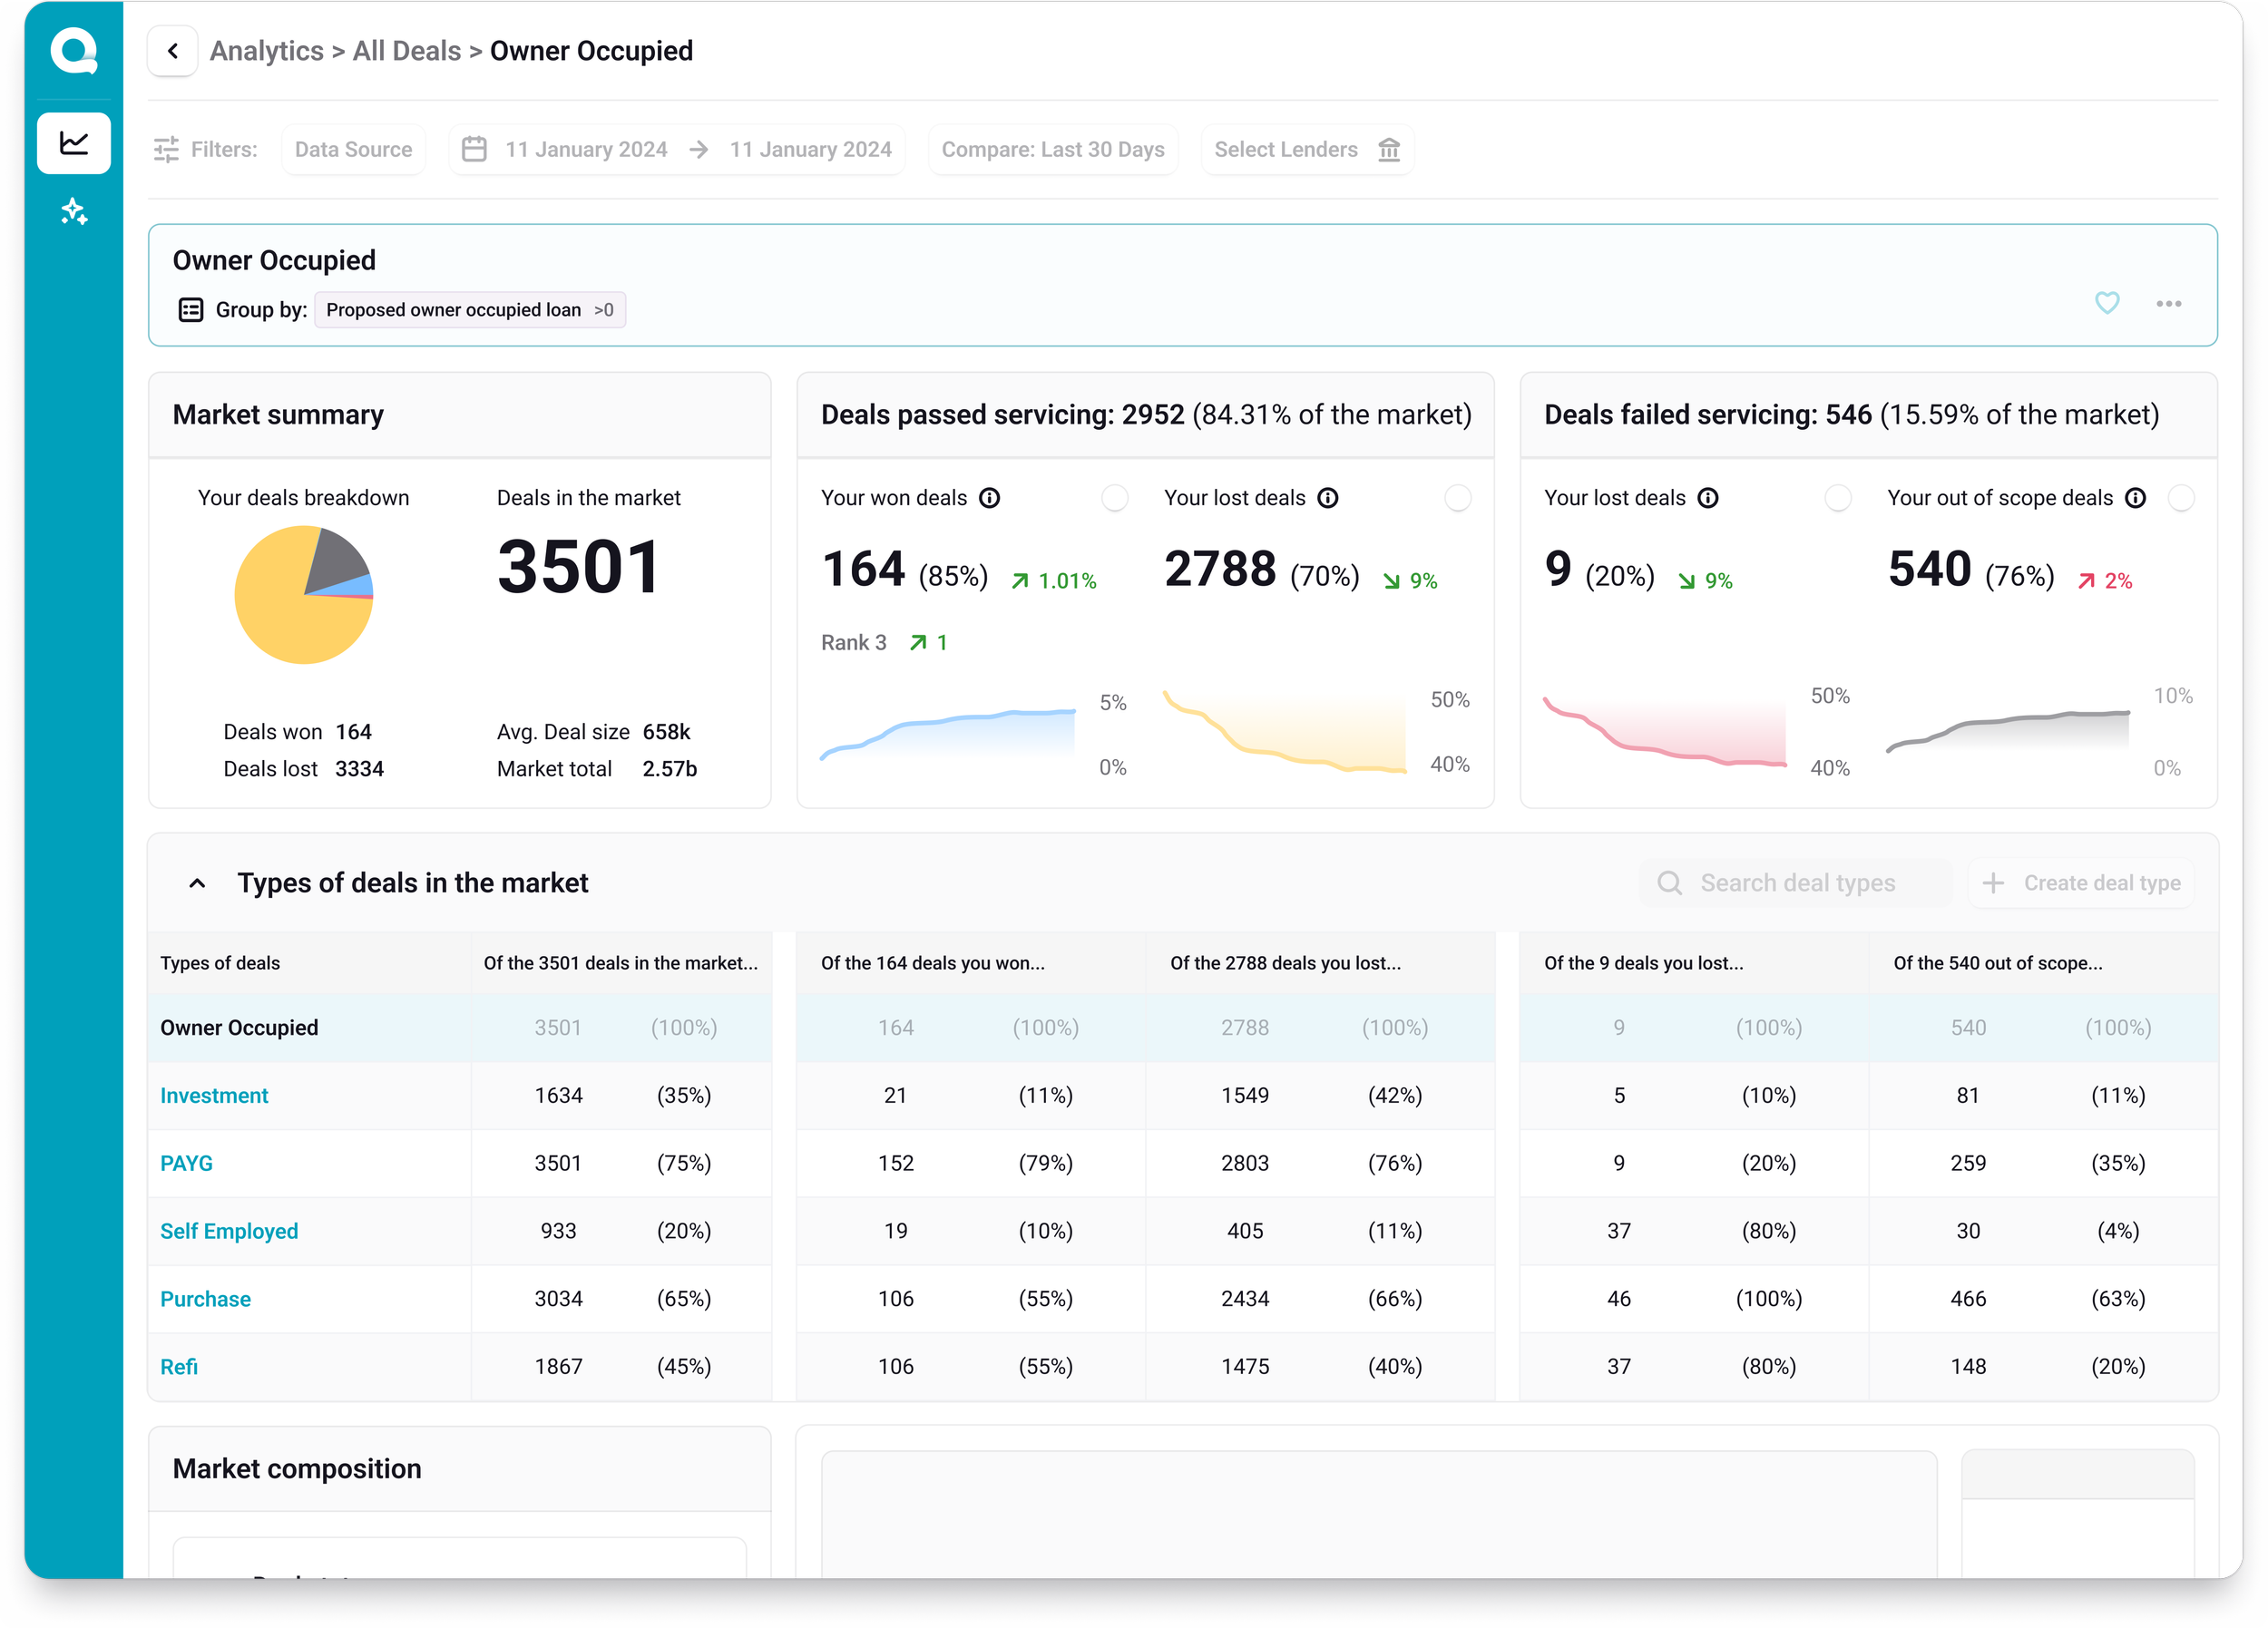
Analytics dashboard capturing 400% ARR growth opportunity.
Product development of a new dashboard feature to create a novel revenue stream.
*Solo designer
*Dec 2023 - Feb 2024
Design challenge
Quickli is a servicing calculator solution for mortgage brokers. 50% of all brokers in Australia use Quickli to calculate servicing.
Since servicing is a leading indicator to lender servicing volumes, Quickli’s data is incredibly valuable for accurately telling major lenders where deals are going and why.
Creating a web app for our 30+ partner lenders would anecdotally replace two full time employees potentially creating a new revenue stream of 2-300k per annum, per lender.
Business Goals
Sell our data:
Present accurate, reliable data to lender analysts in a palatable method so they can analyse trends in the market and make valuable predictions for their policy decisions.
Stronger relationships:
Proving value in this space enables further conversations with lenders about custom building their servicing calculators (another existing initiative).
Other opportunities:
Quickli’s core mission to become used by every aussie broker is strengthened by every new lender added to the platform. Incentivising other lenders to join the platform through this new offering will inevitably increase broker acquisition.
User Goals
Data manipulation:
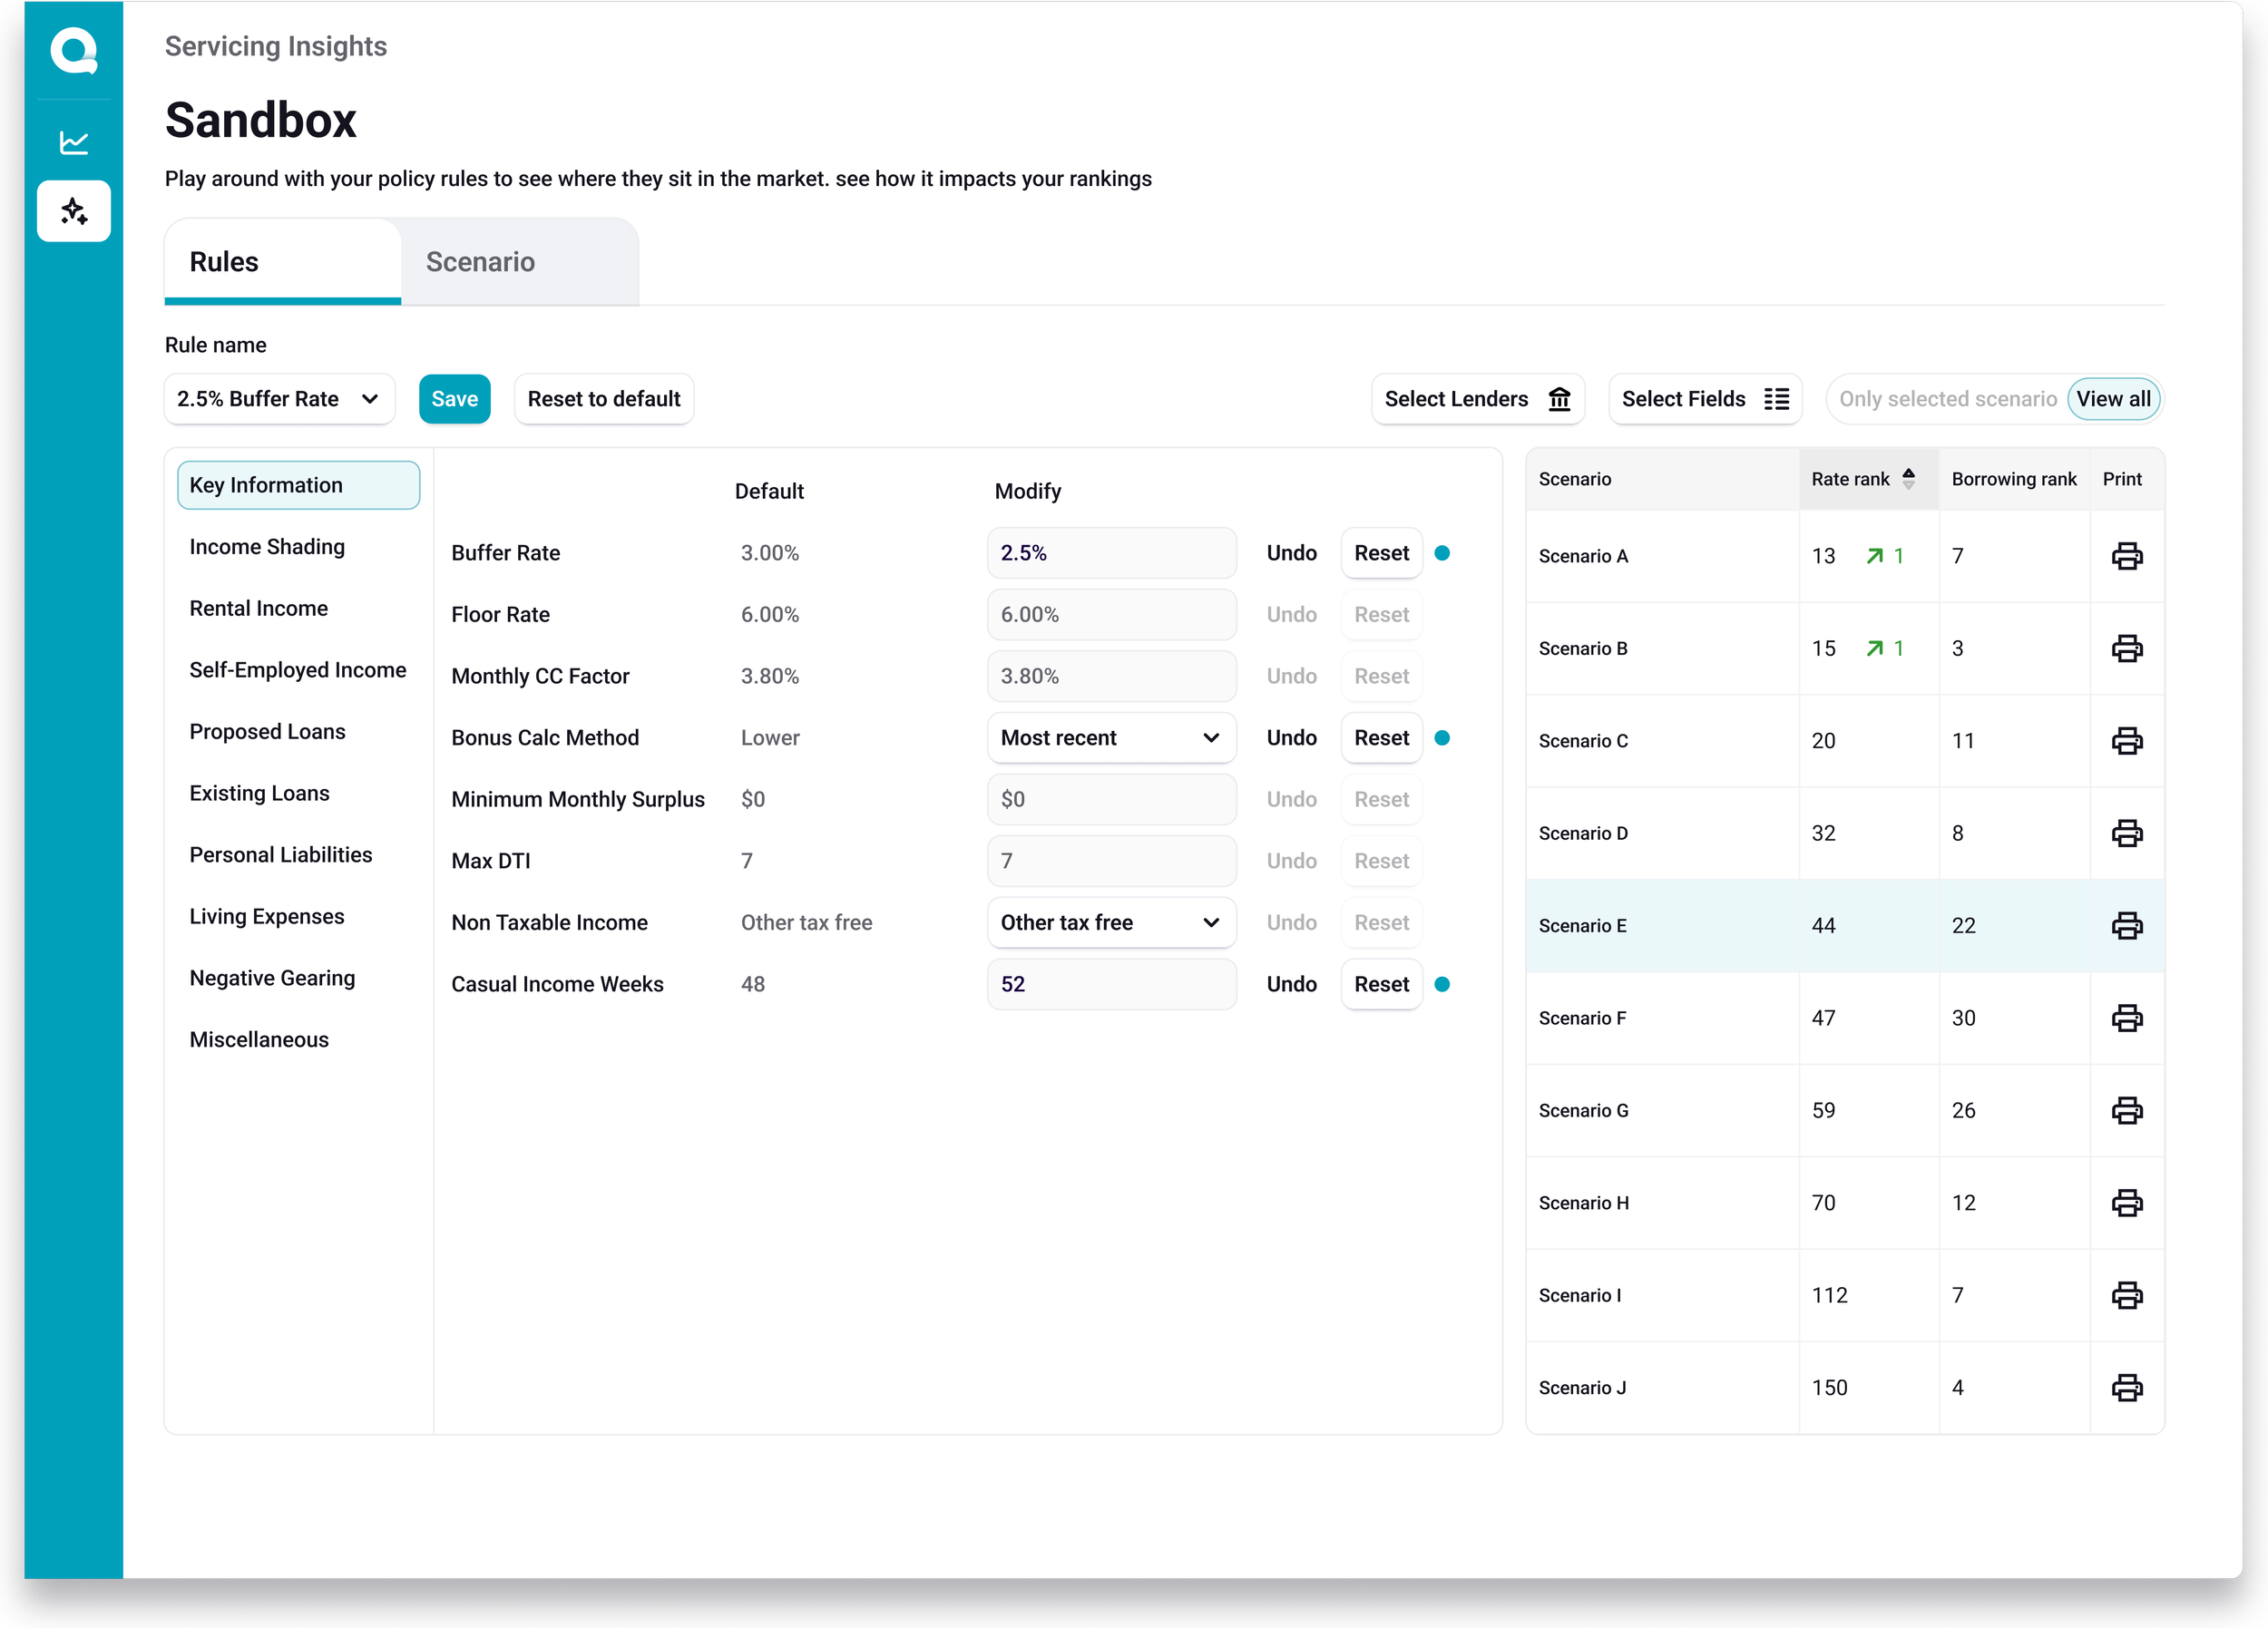
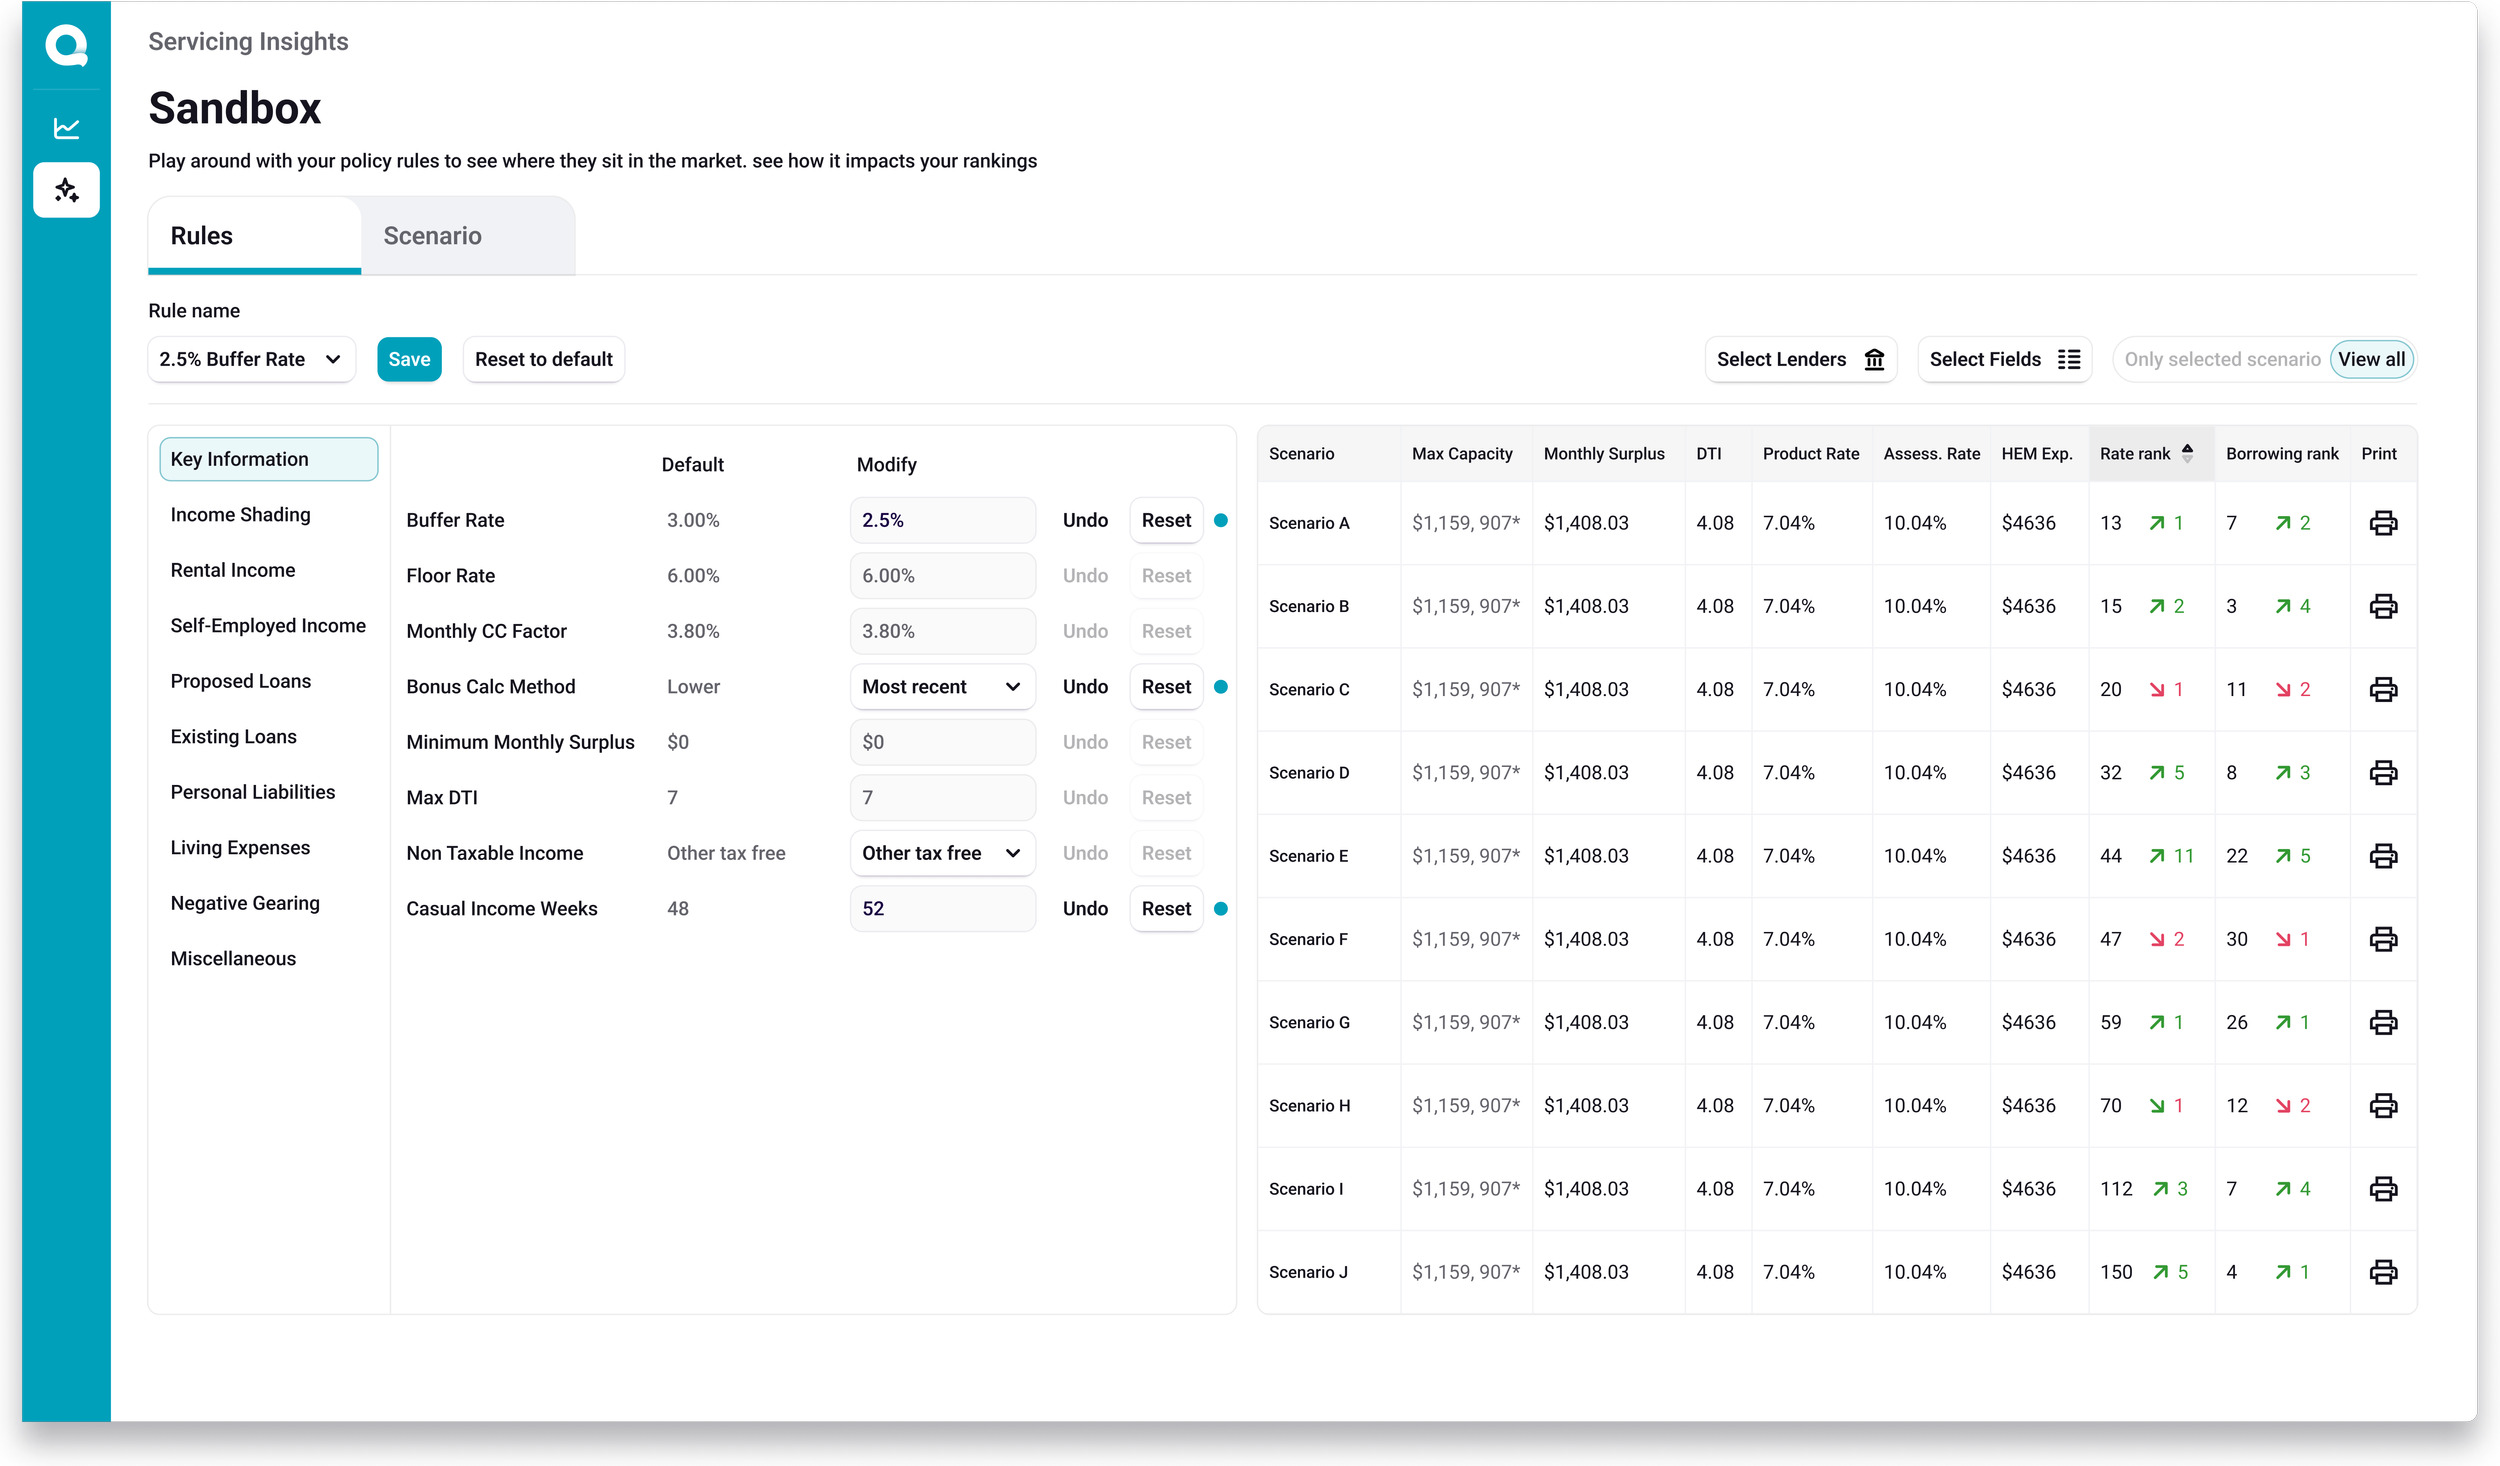
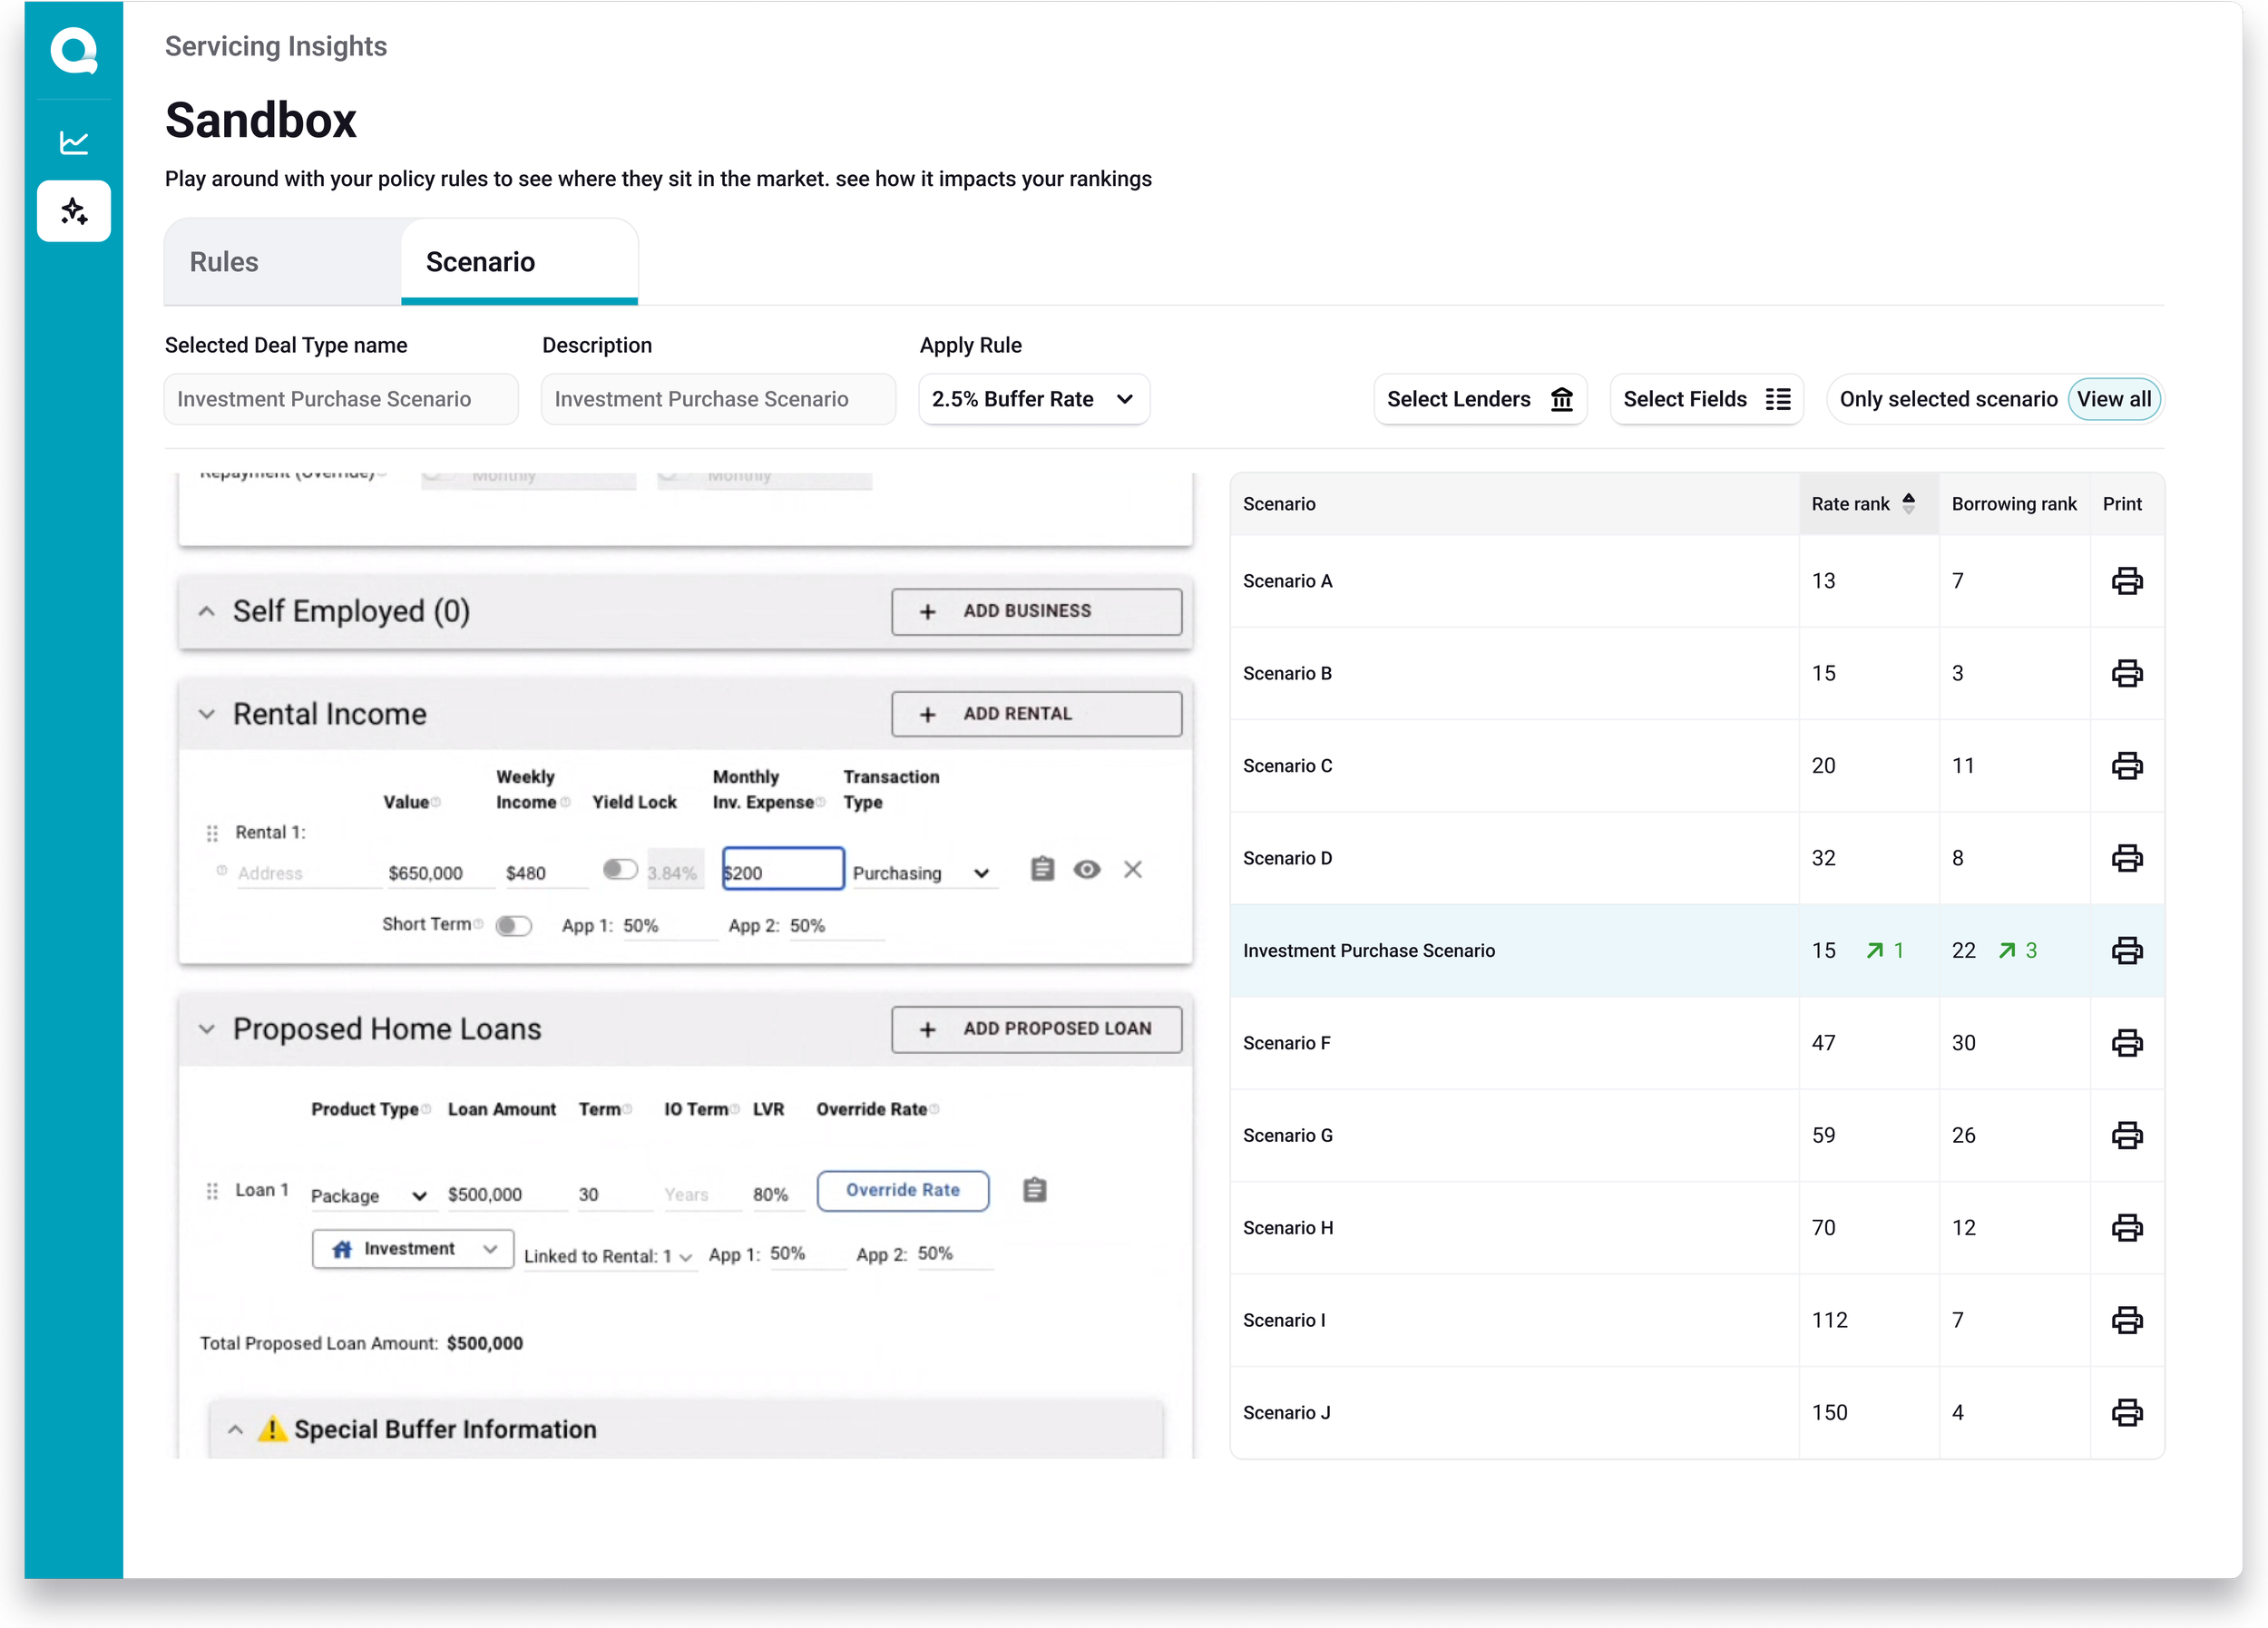
Search, sort, and customise data sets interchangeably on x/y axis to view general trends and hyper specific policy niches.
Connect data to business:
Provide high level wholistic views of the market that can quickly dive deep into specific data points.
Multiple users:
Empower analysts with complex creation capabilities while also enabling comprehensible viewing capabilities for C-suite execs.
Making of the dashboard
Researching the opportunity
Understanding the data
Identifying “when”
Determining “who”
Understanding “why”
Designing the dashboard
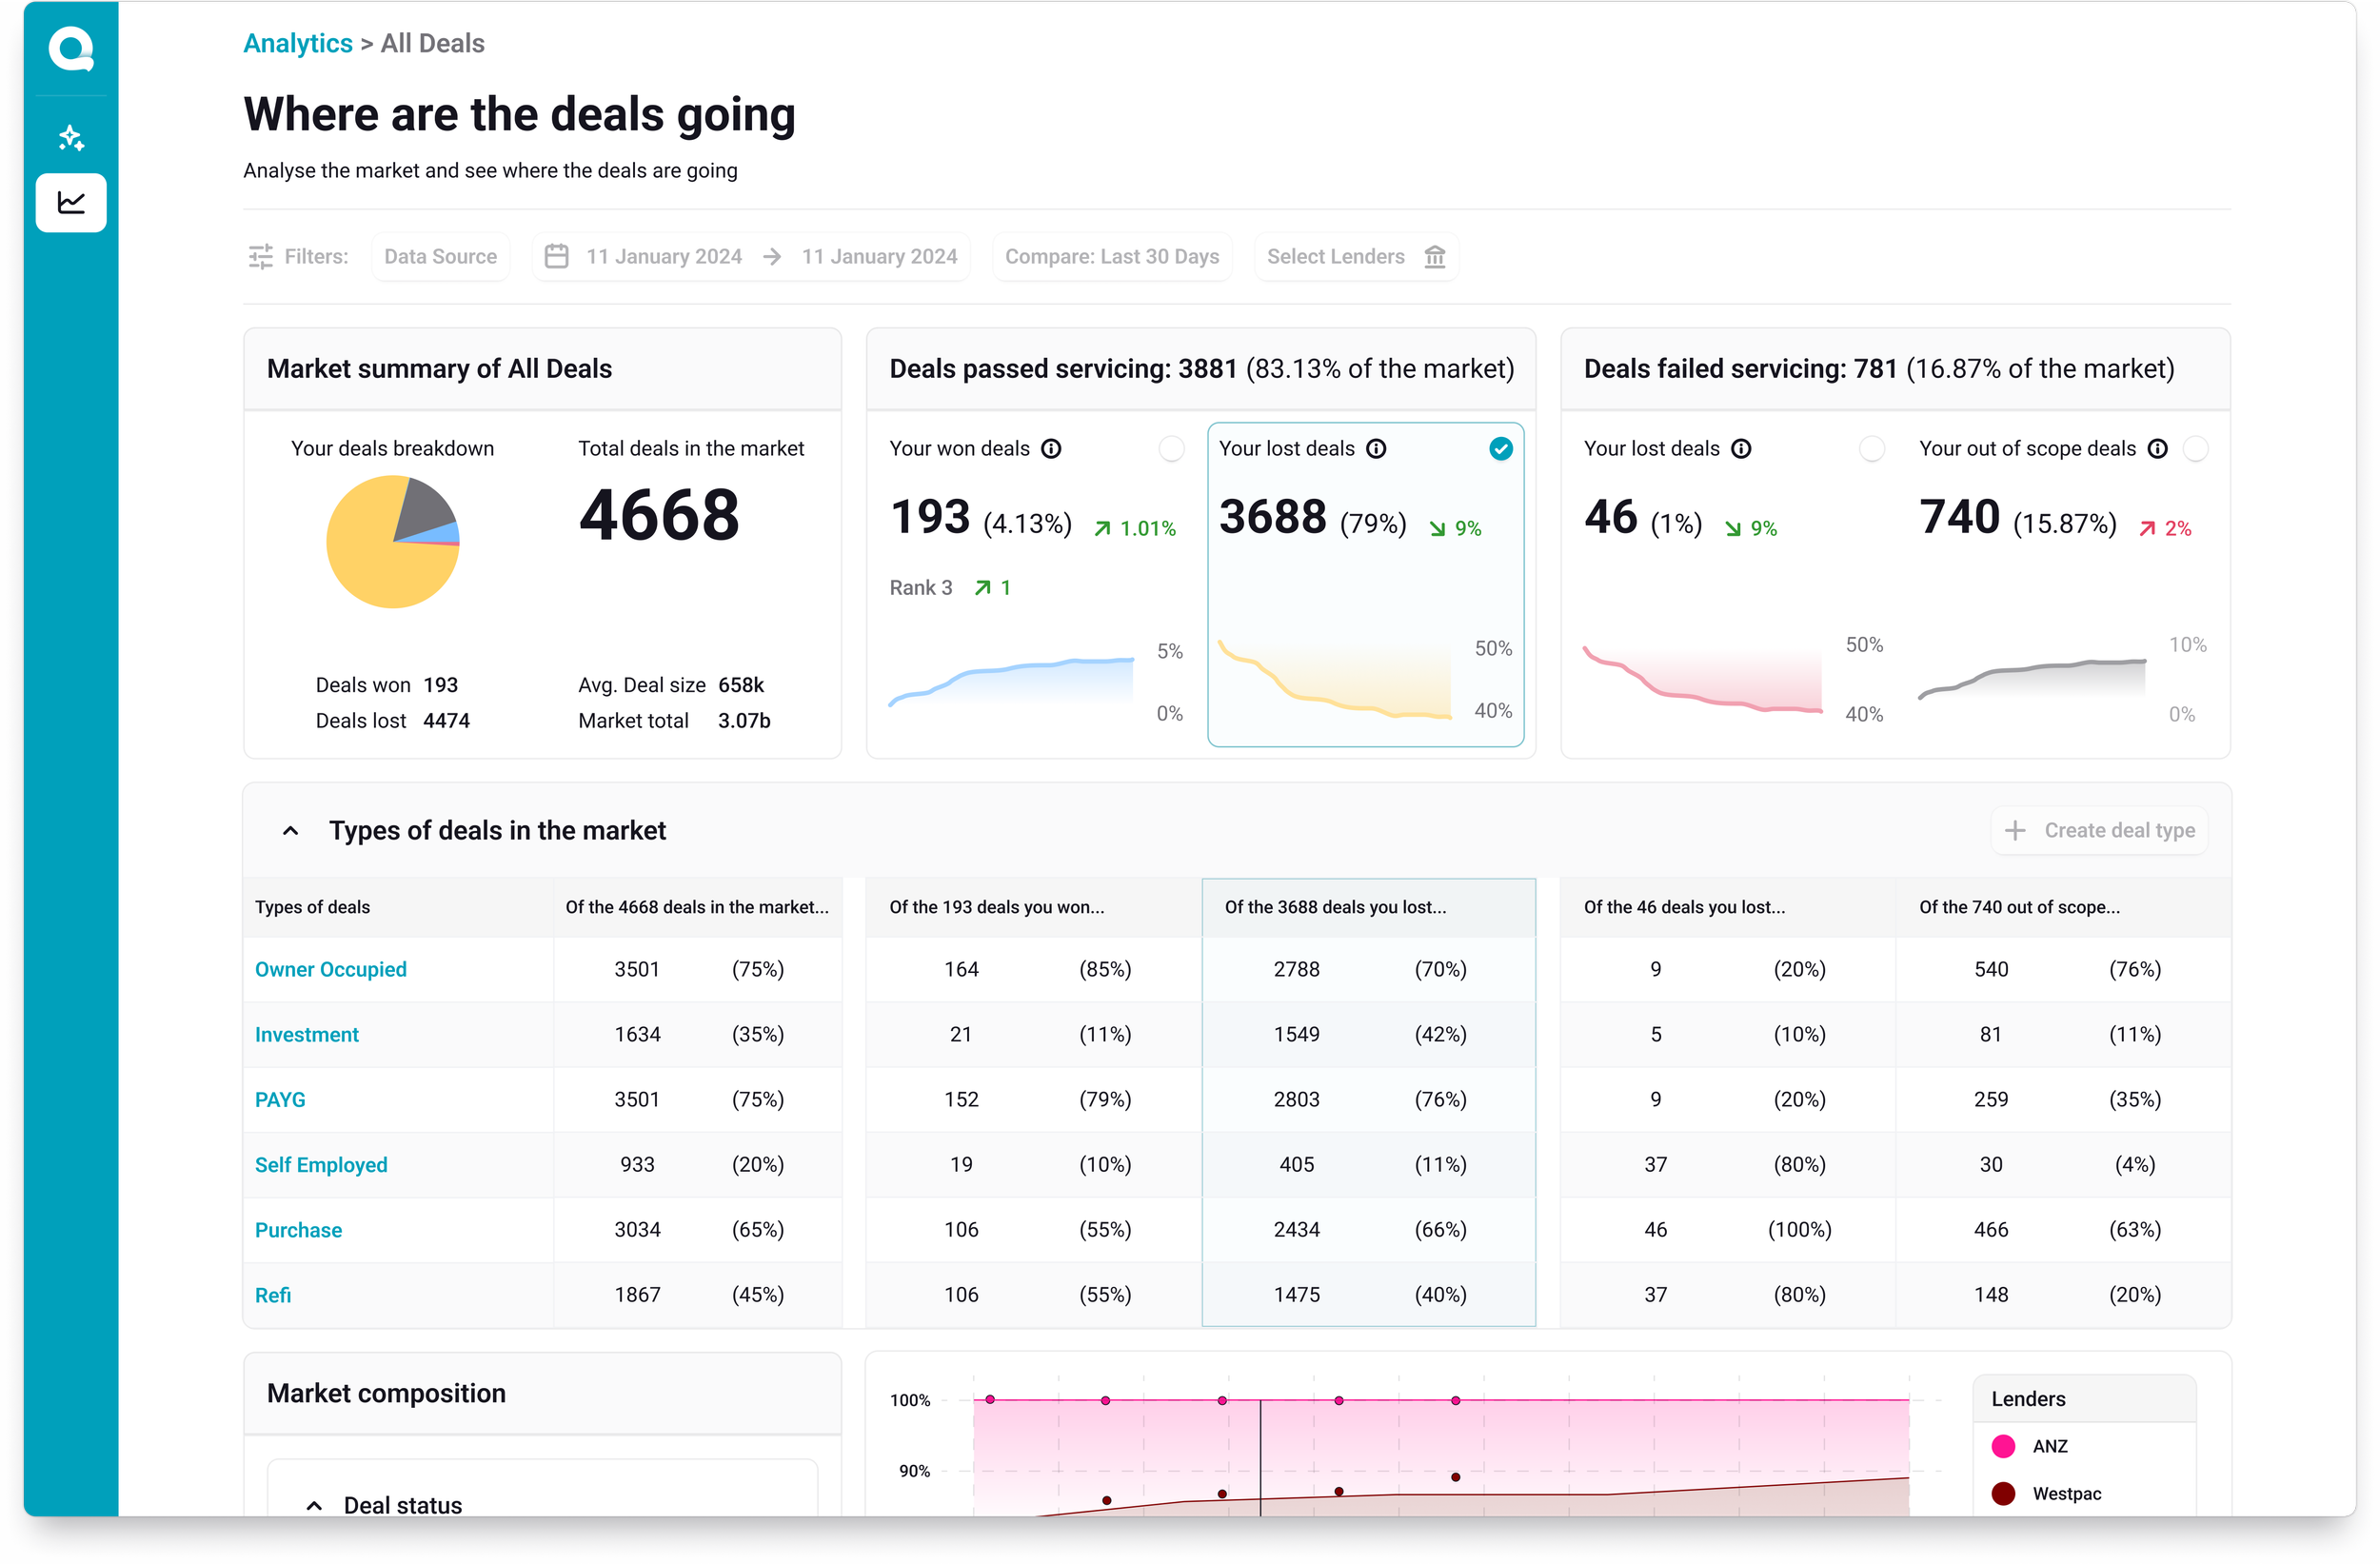
The results
Researching the opportunity
Quickli validated a market niche by meeting with c-suite executives at major lenders including Bank of Queensland and UBank.
Through these interviews we learnt that lenders are desperate for accurate data on the broking market because they are limited to the deals they are winning; the have no information on the deals they are losing.
Quickli sees half of all australian mortgage deals. We therefore hypothesised we could create a dataset comparing each winner’s policy decisions against the losers to identify trends, draw parallels, and pinpoint why deals go where.
We would then be able to sell these insights to lenders at the price of what was currently spent on calculating servicing - 2 full time employee’s salaries.
Understanding the data
In order for us to create a dataset, we first needed data collection. So our first roadblock was determining what data we have and what we need to know to identify where a deal went.
We started by asking these questions:
WHEN was the deal “completed” - collecting quantitative data
WHO had won the deal, - overcoming Quickli’s limitations with qualitative data
WHY did this lender win - data analysis to identify the key factors that determine deal success.
Understanding these questions would provide us the data we needed to build the dataset that targeted our user’s biggest needs.
Identifying “when”
I mapped out the flow of a user from deal creation to “completion” and identified existing sources of “when”.
The first was exports, a key part of Quickli’s sales prop and “aha” moments. Exports exist as a quick way for a broker to download their chosen lender’s calculator, now filled with their client’s information. Usually this calculator is lodged with the chosen lender. We could therefore make the assumption that exports = winning.
Because this was not an absolute guarantee, we cross checked exports against "insights”, the breakdown of lender policies, which we knew from broker interviews were usually only ever chosen when the broker was thinking of lodging with that lender.
Determining “who”
An obvious answer to who won the deal would be for a broker to tell us.
The issue was Quickli’s core platform was not a simple a to b flow, it was maleable like the nature of broking, which often requires changes and updates to information.
This realisation led to the addition of a new field on the core platform that brokers could select the lodged lender.
However because of a small data size and it being optional, we combined this with “when” data to create our dataset.
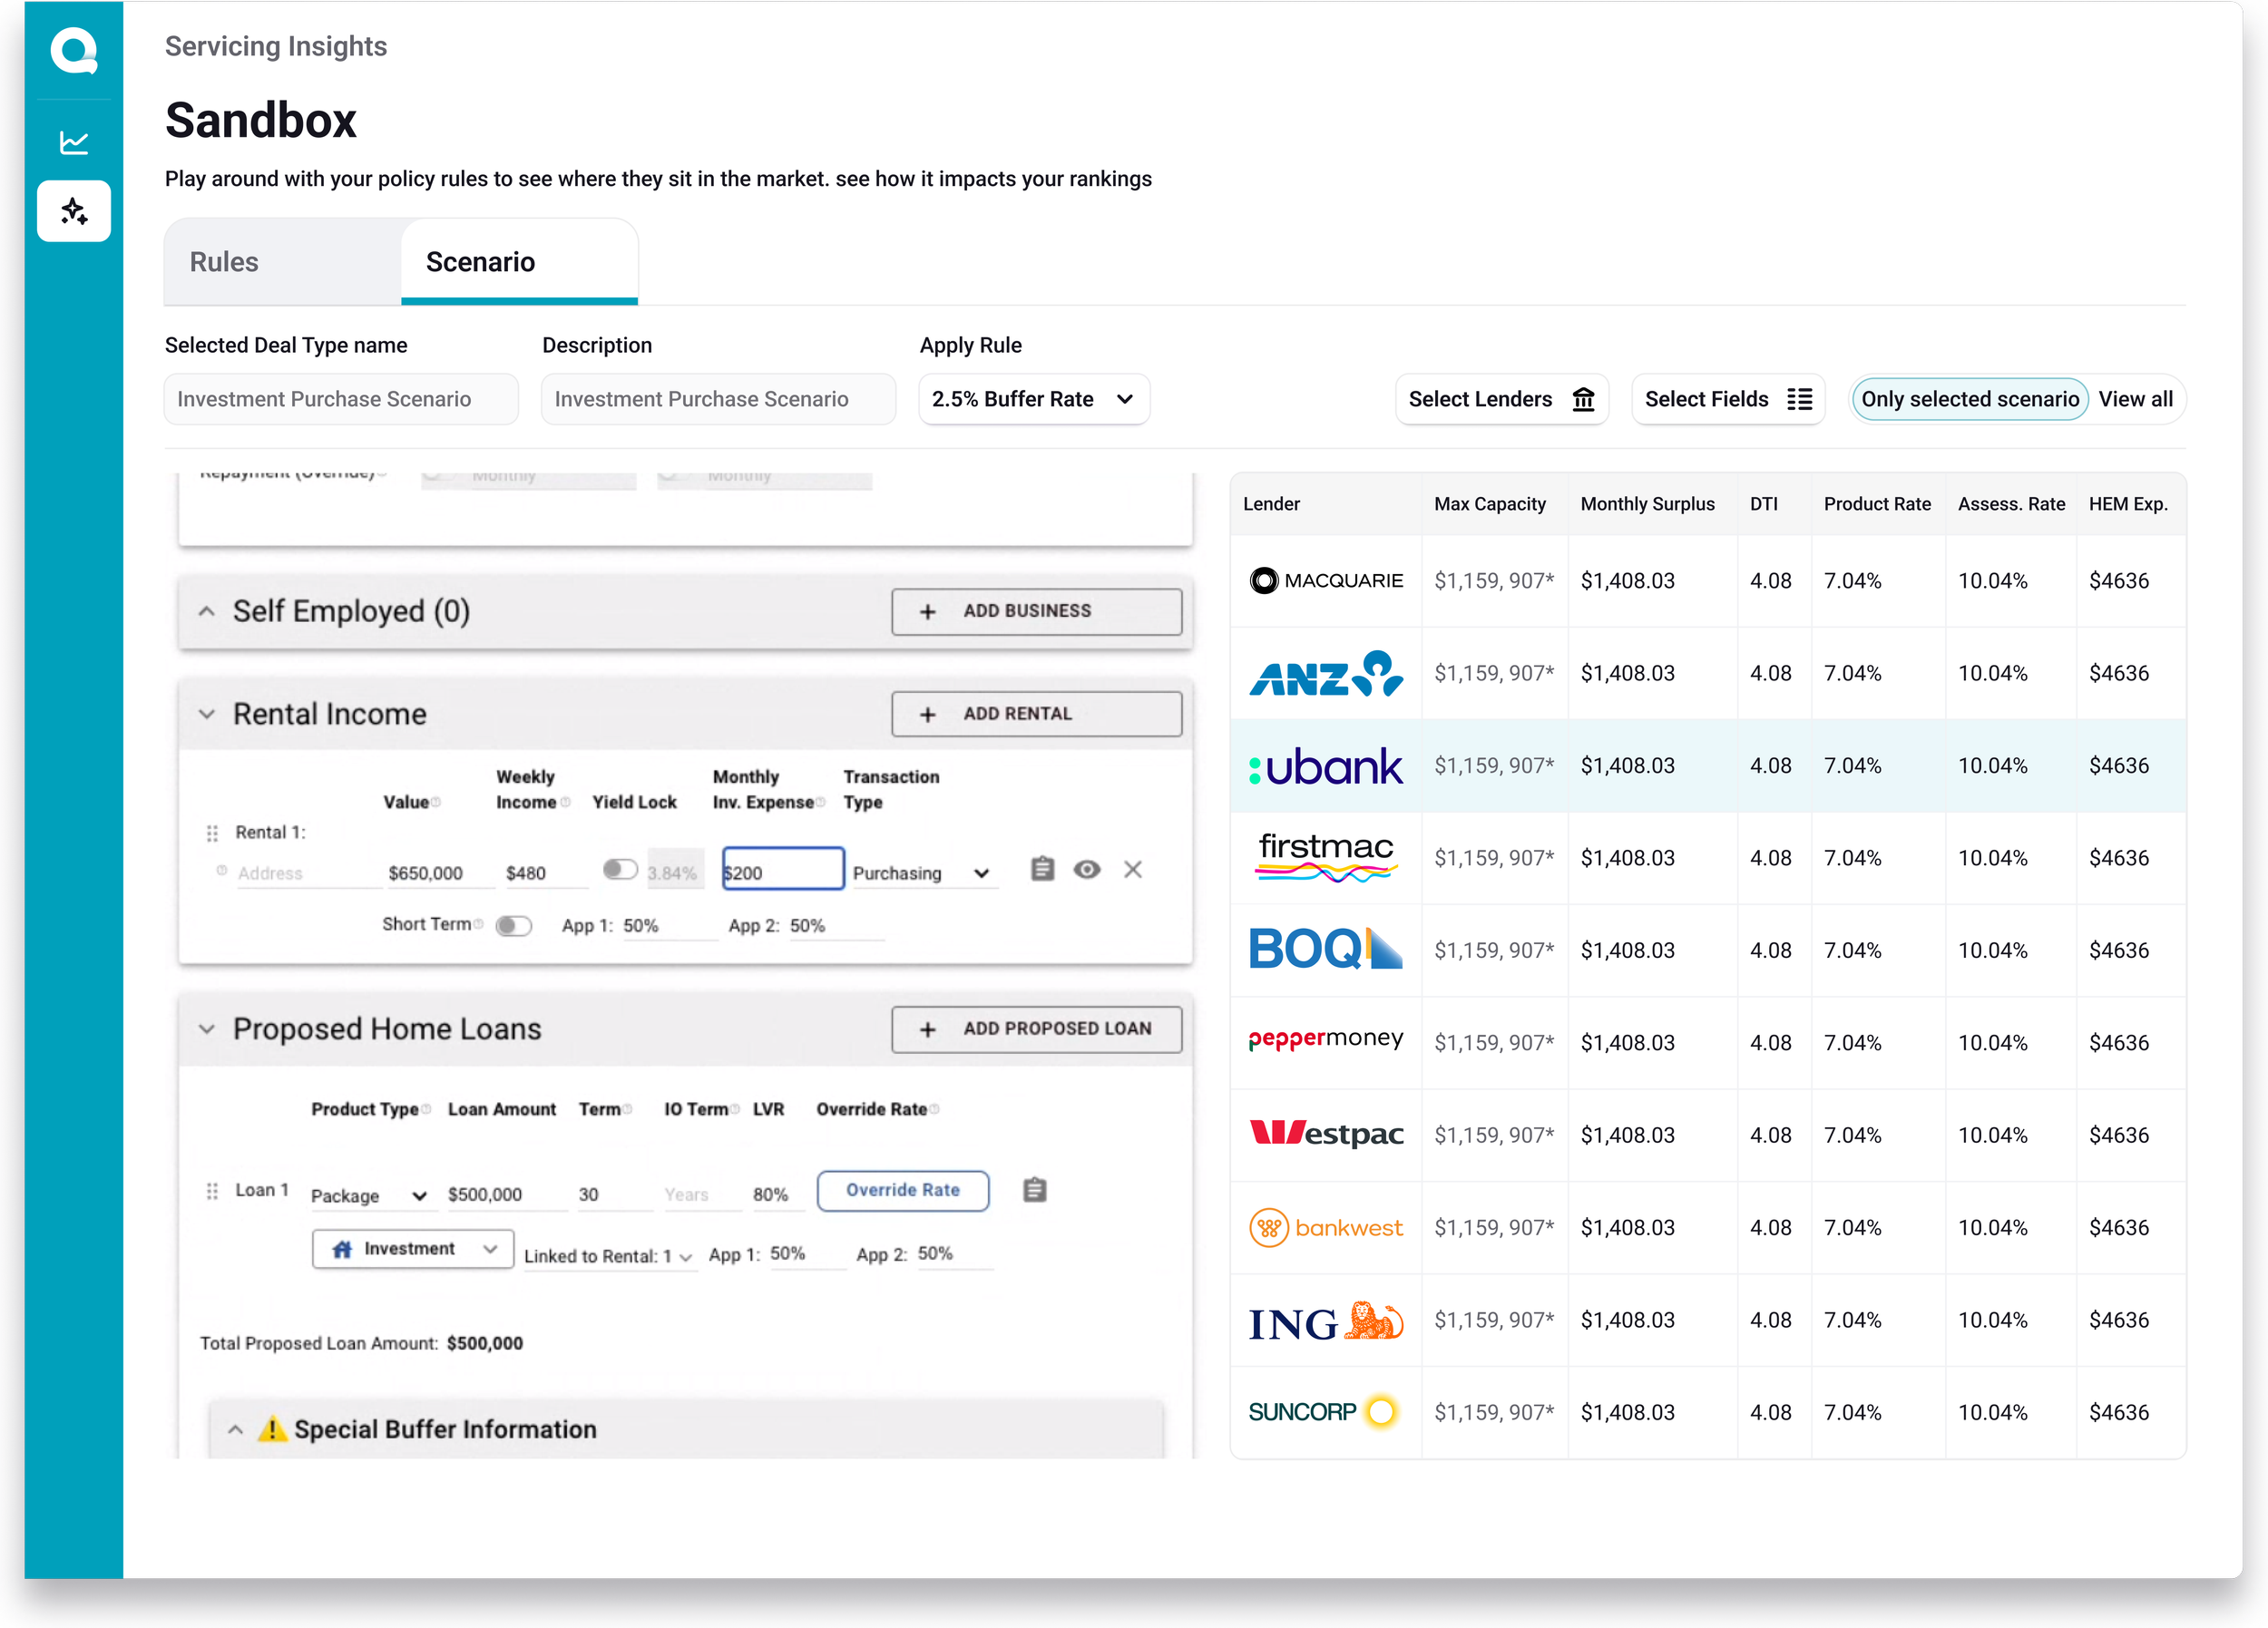
Understanding “why”
There are alot of fields that are included in a Quickli scenario.
The PM and I agreed on the most important fields as
Max capcity
Lender name
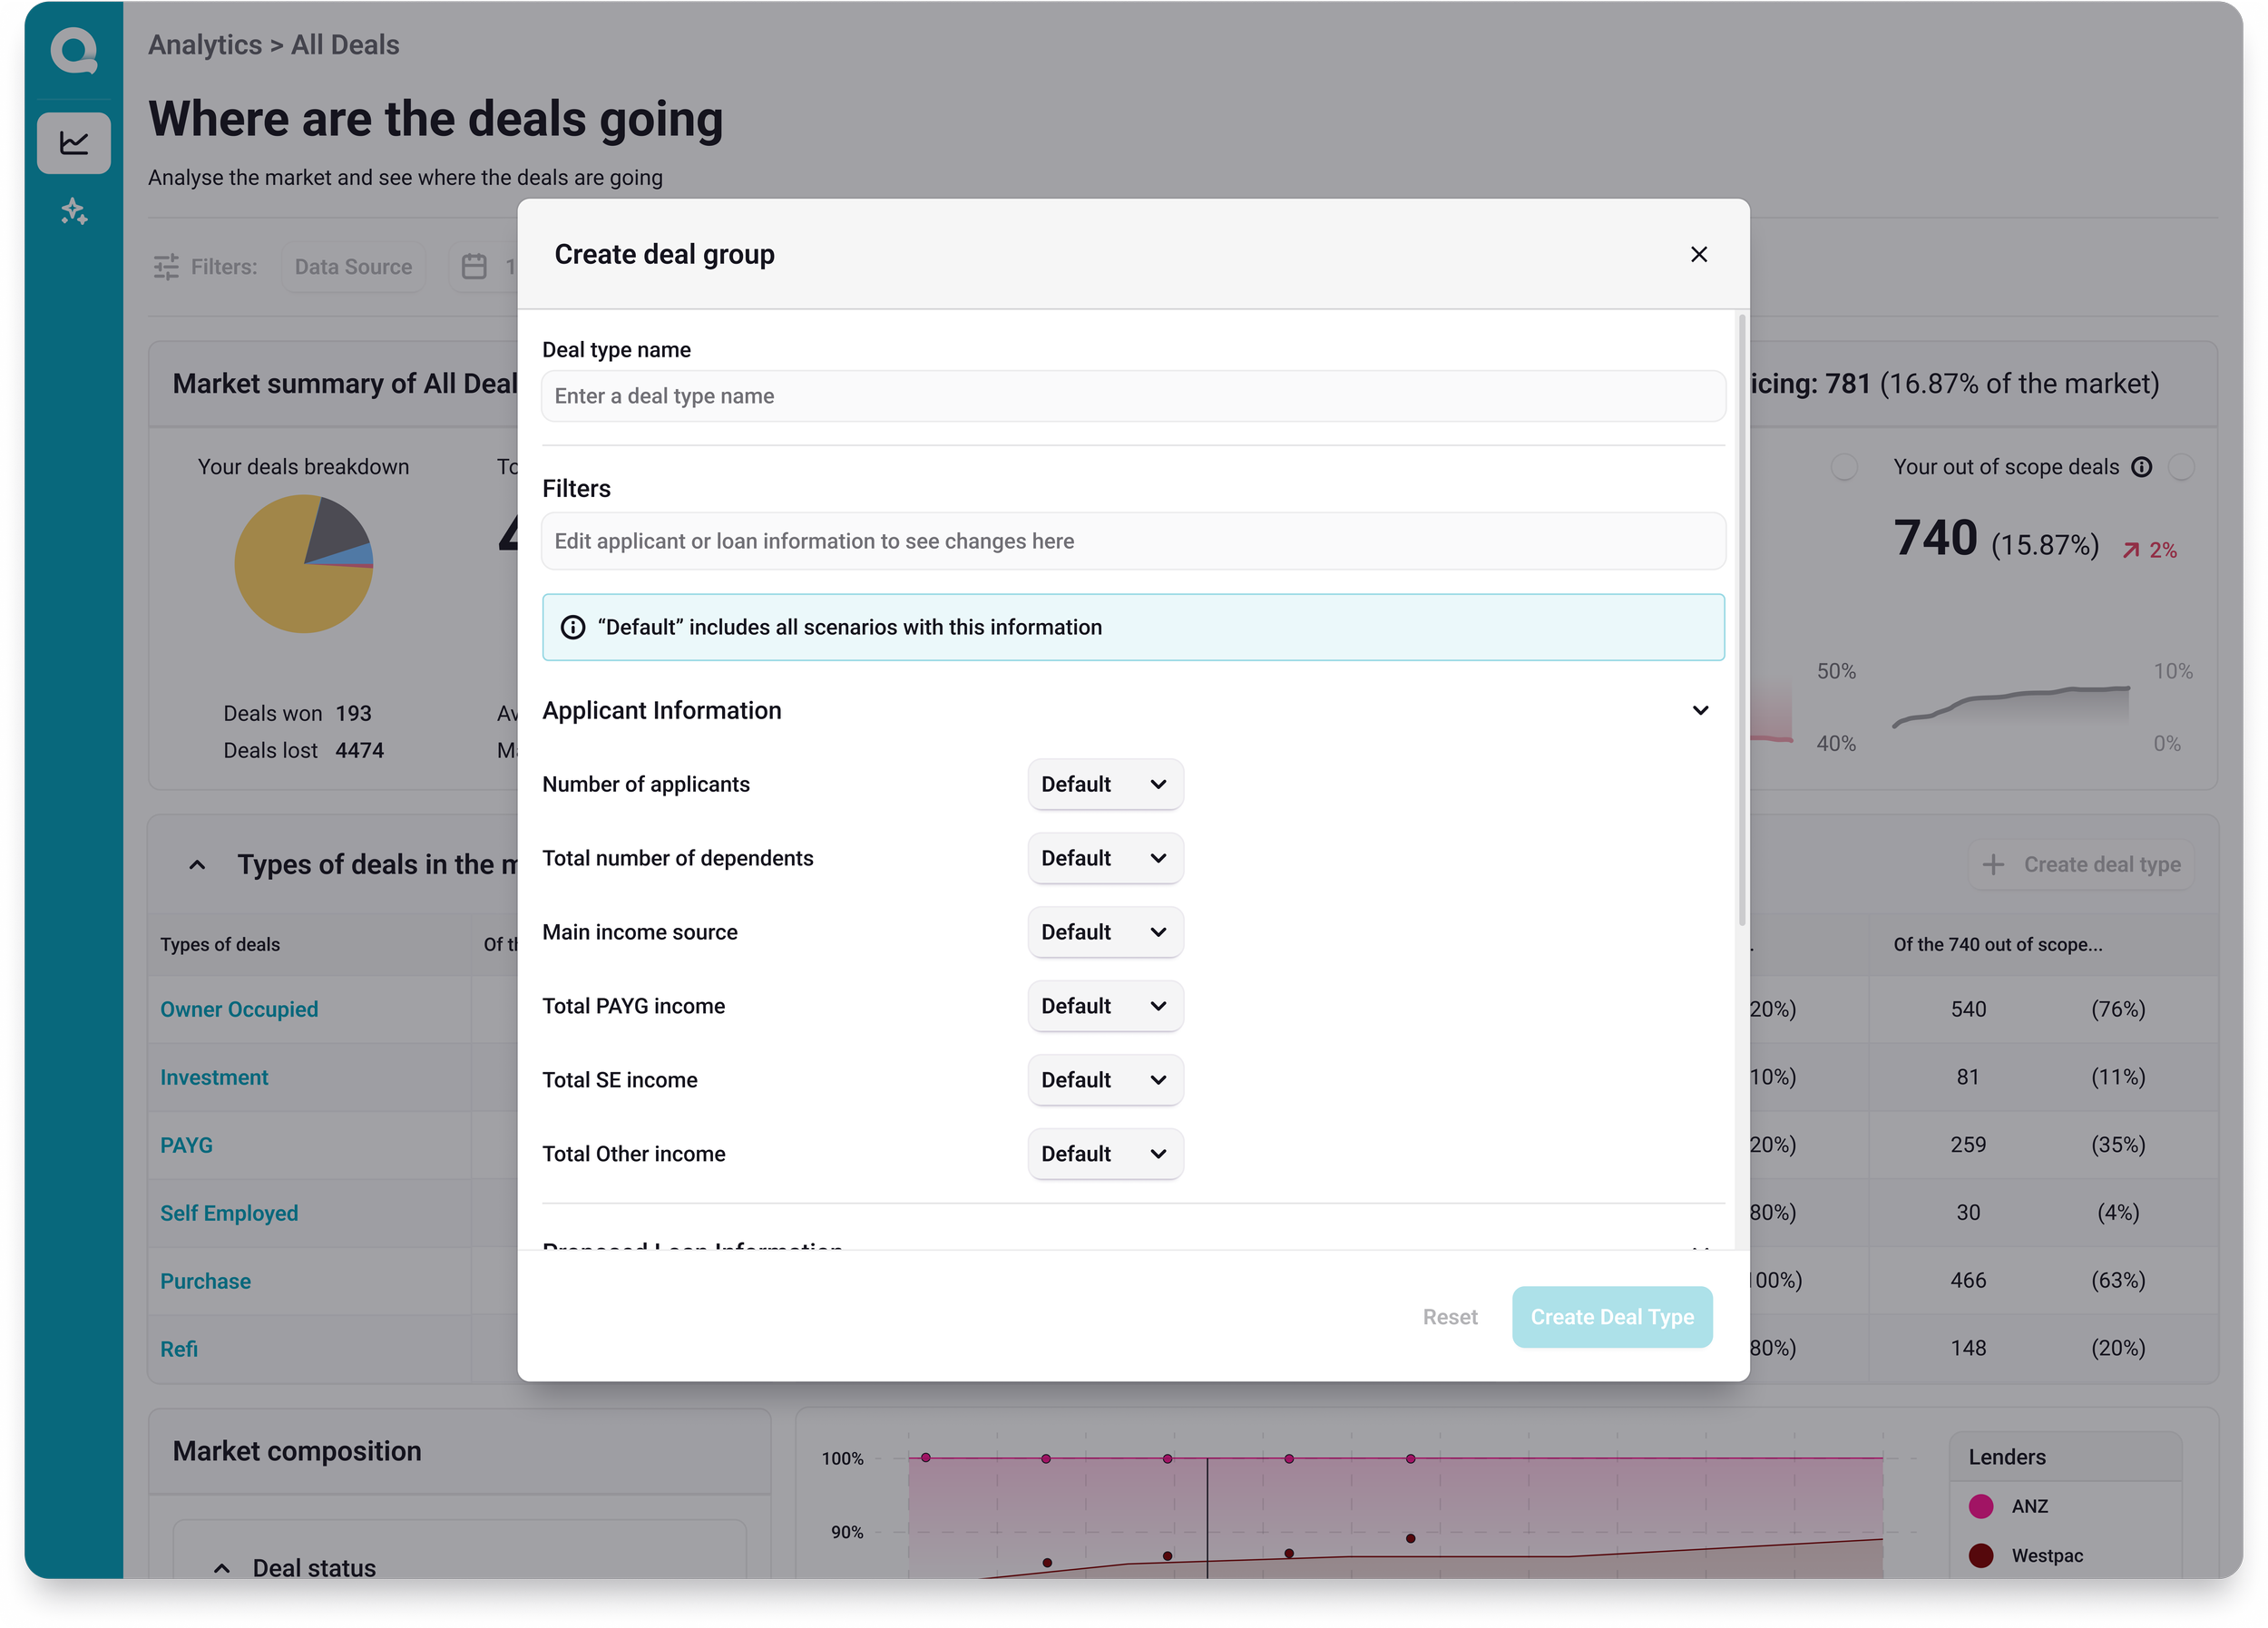
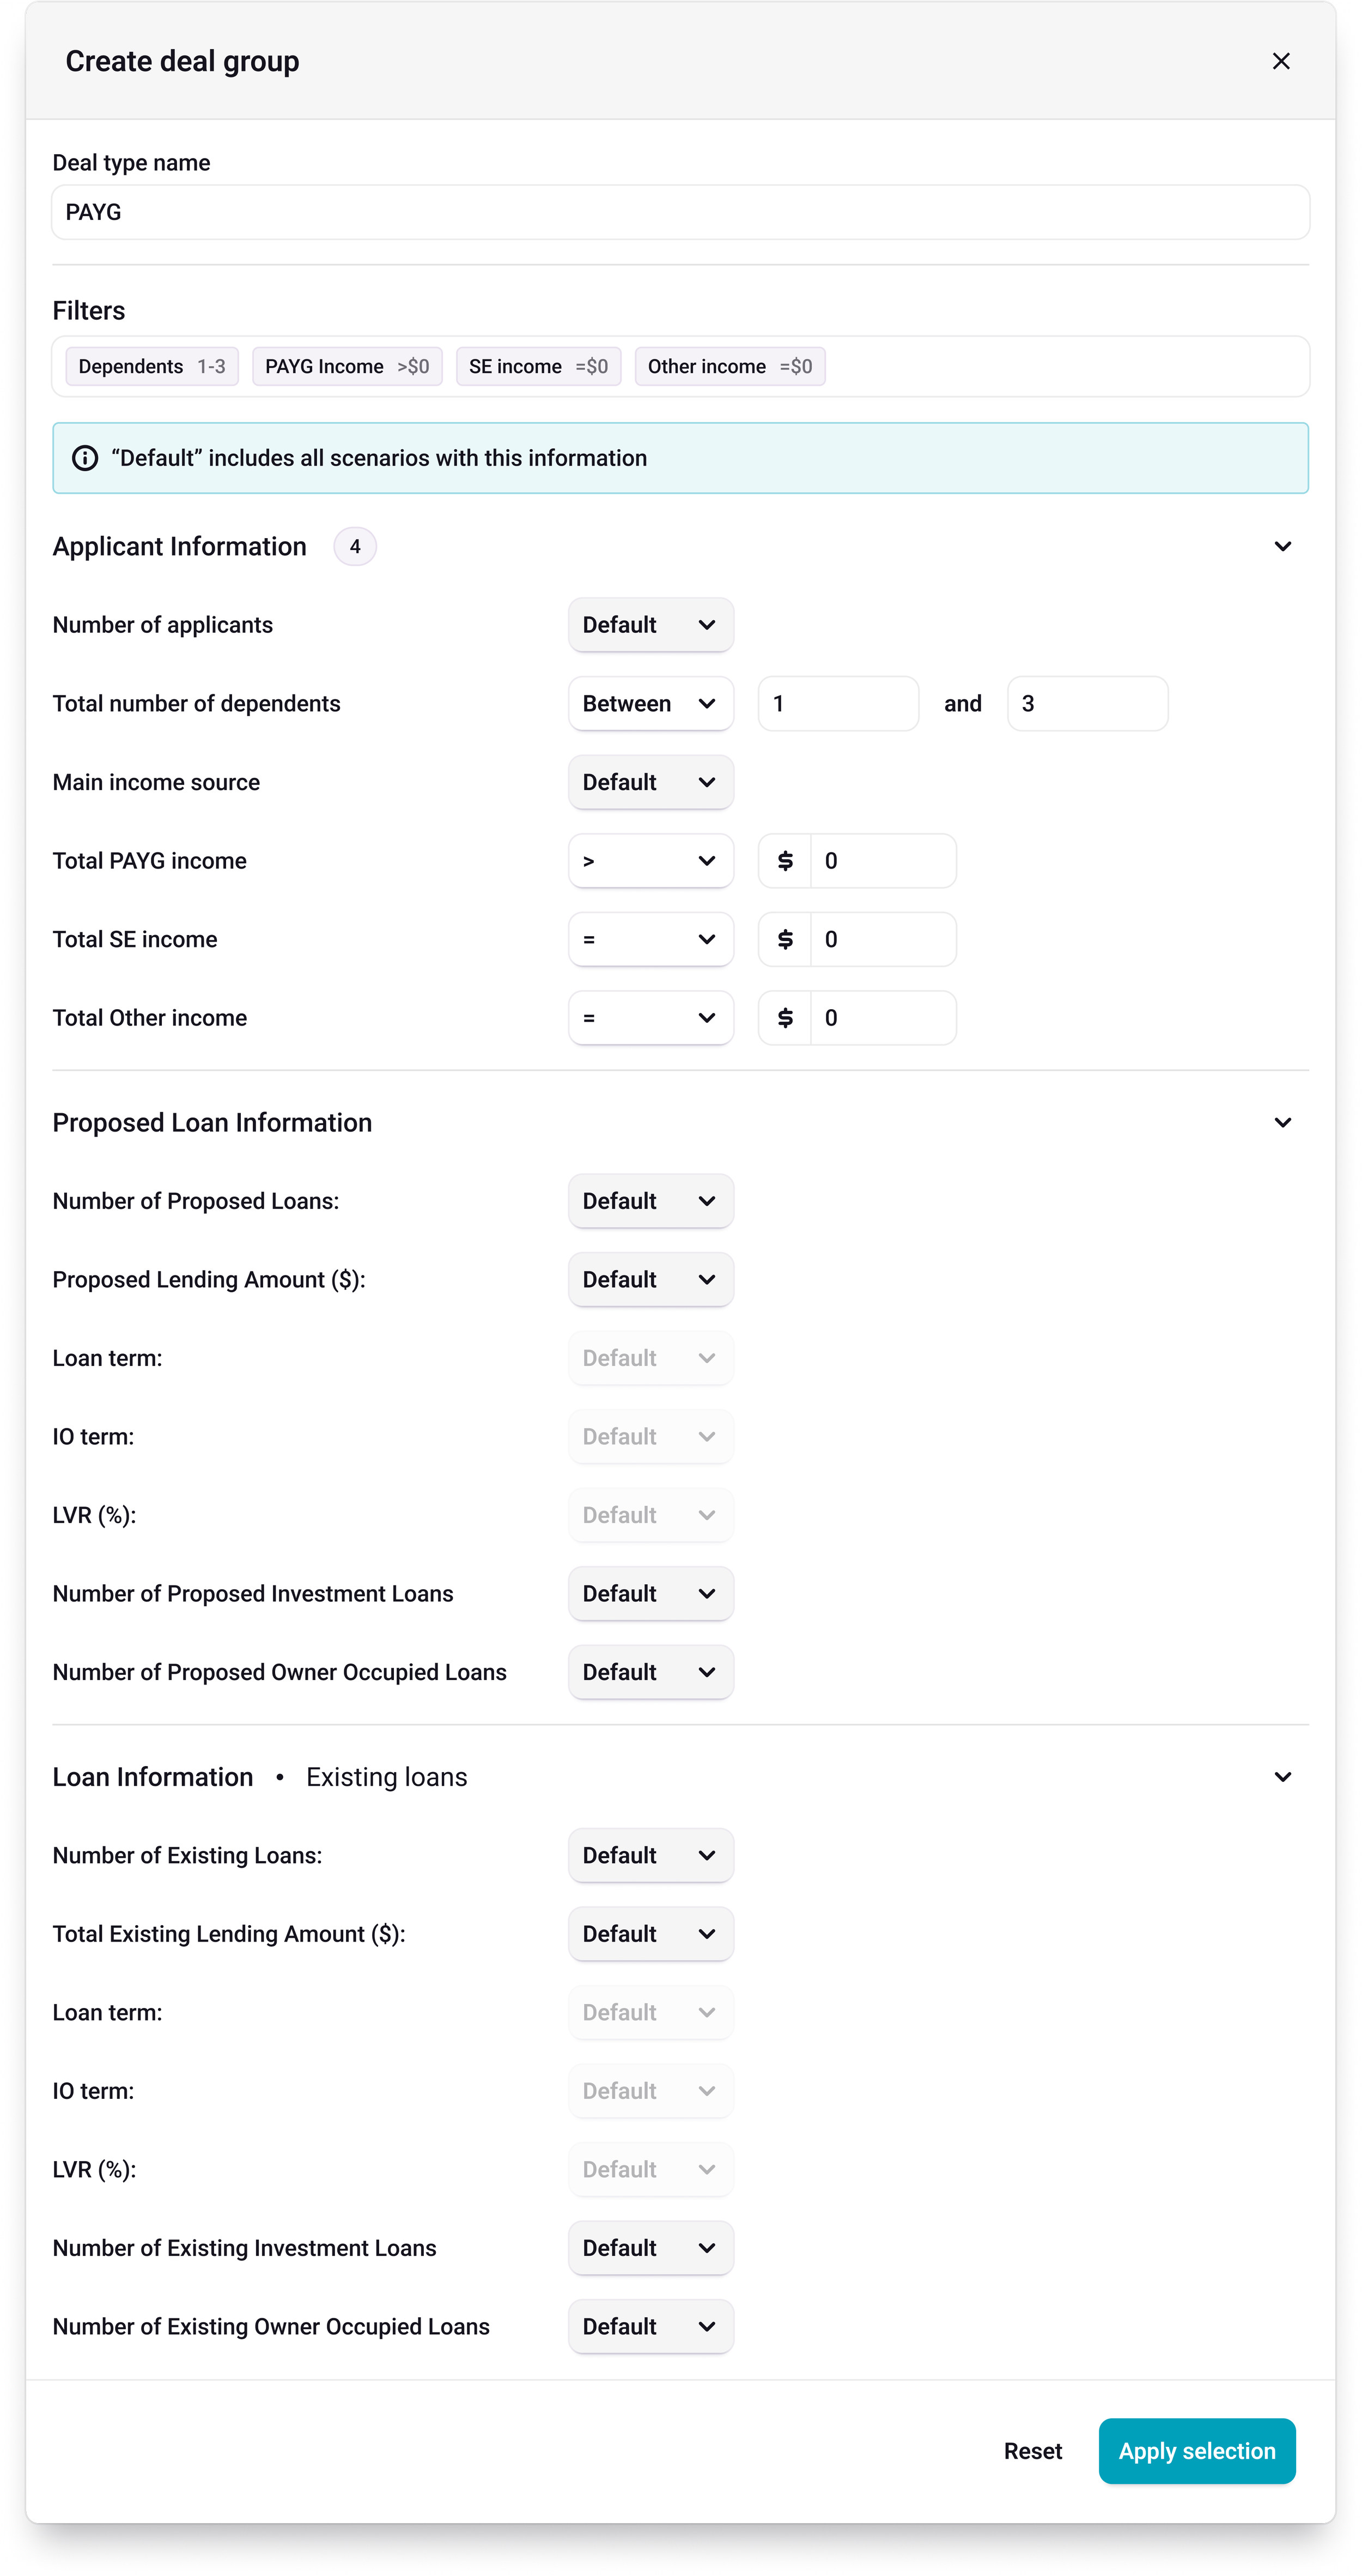
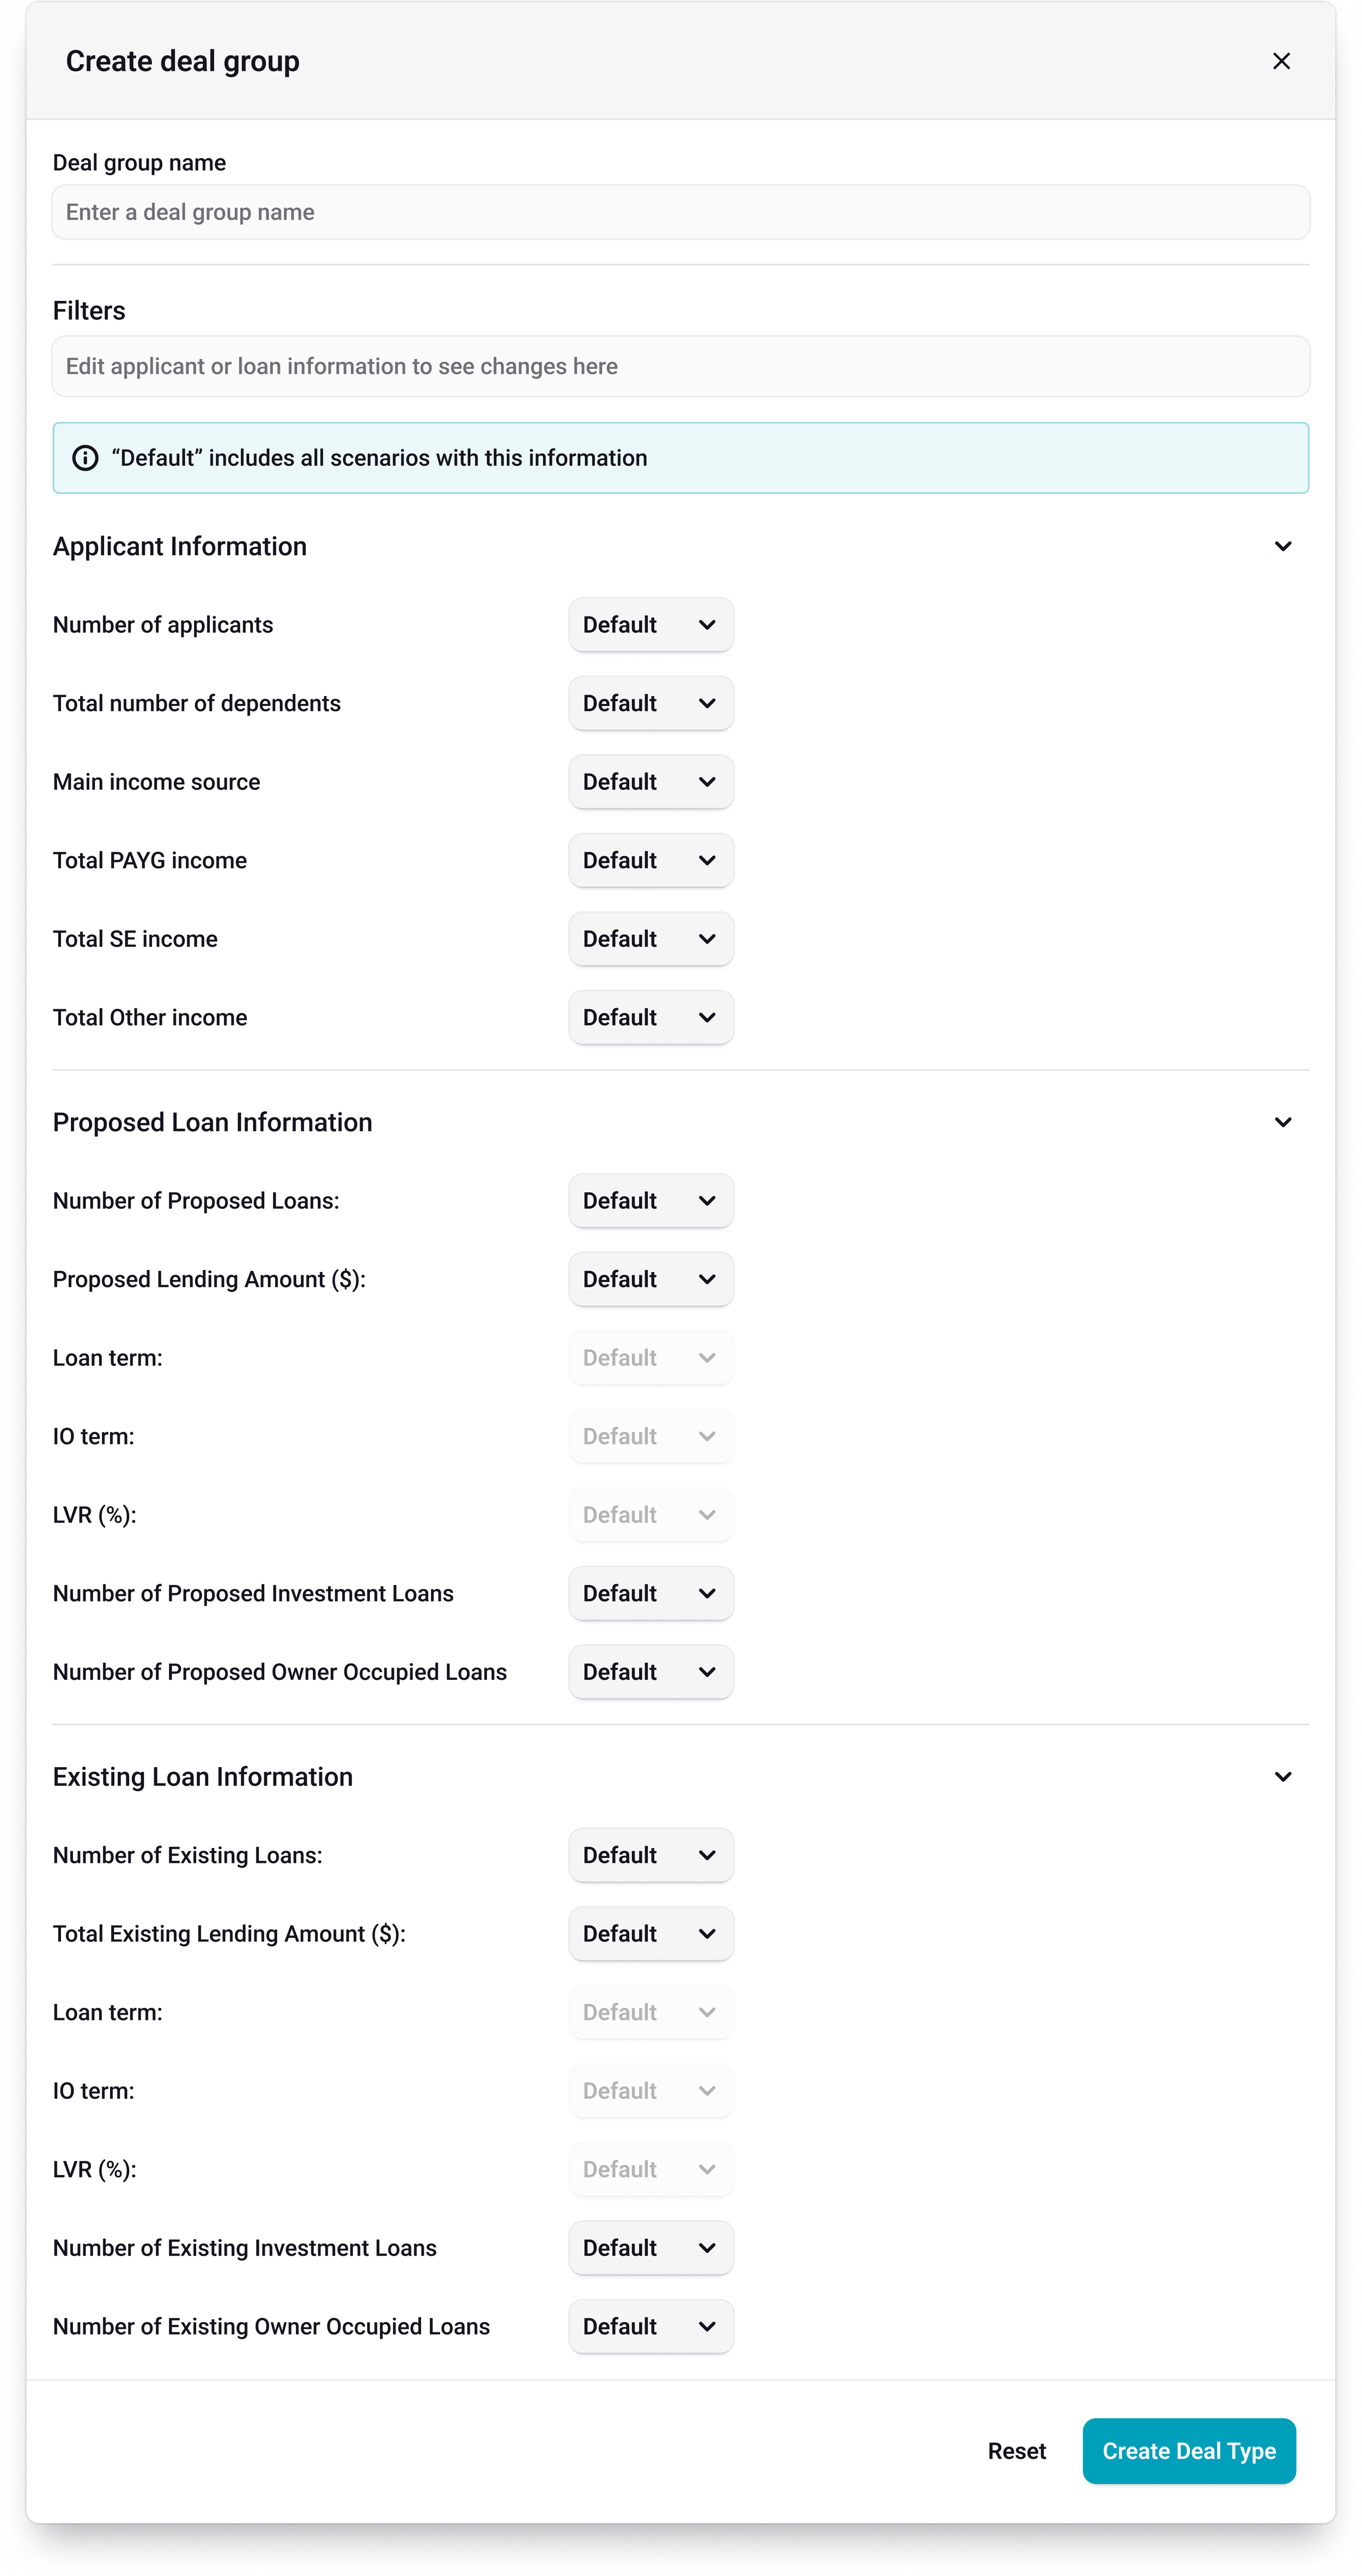
Designing the dashboard
Multiple iterations from lofi to high fi were created in sync with engineering to ensure we could work in an agile manner.
Internal stakeholders provided feedback on usability and answered key questions we expected from the lender executives.
The results
The highest potential revenue growth feature.
New market opportunity.
Successfully pitched to C-suite executives at 5 major lenders. Next step discussions are underway.
Parceled our data to make it commercially viable.
Created key understanding of our novel sales prop as a lender servicing database.
What could we improve
Tight deadline meant we had to really reduce the scope and complexity of the project.
Interview research was limited because our target users were c-suite executives who had very narrow meeting time windows and there were lots of questions to answer.
The data we had available was narrow in its capacity for slicing, if we had better data collection we could provide a more customizable experience.
We are also limited by the data available because it must be parsed in a specific way to be usable.
My role in this project
Wireframing of the user flow.
Identify and translate raw data into useable data.
Rapid prototyping for usability testing purposes.
Final visual and interface design.
Collaboration with PMs, Engineers and SLT.
Ideation and creative experimentation.