

Reporting feature sees successful renewal of $10m ARR
Agile product development of a new reporting feature to cater to largest customers.
*Lead product designer
*Sep 2022 - Feb 2023
Project environment
The project was a full agile environment with a scrum master covering a single global team.
8 engineers, 1 scrum master, 1 data analyst, 1 product manager, 1 product designer (me!)
Daily standups at the (virtual) scrum board
User stories organised by most impactful down to backlog.
Fortnightly sprints and retros.
Business goals
As a cybersecurity education SaaS B2B, SCW customers need to be able to quickly monitor developers' advancement in learning secure code and compare it to the rest of their organisation.
But with no self-servicable pathway for our customers to view and understand the progress of their developers using the SCW platform, several customers worth $10 million dollars of revenue were threatening to churn. The reporting project was therefore mission critical for SCW.
User goals
Create a reporting feature which addresses our customer’s needs and is easily self-serviceable.
Help stakeholders whenever and however possible.
Create a “positive experience” for customers to prevent our at-risk customers churning.
Personal objective
I worked very hard to elevate the internal perception and importance of UX design within the entire organisation by fostering a systematic, open, and transparent approach to the UX work.


My UX process
Research
Who are the users?
What is the offering?
What are the goals/deliverables?
User Journeys
How is reporting done currently?
Collaborate and build relationships
Customers, Stakeholders, Engineers, CSMs, Data analysts
Customer feedback
Design (early low-fi) and socialise with stakeholders
Keep everyone in the loop to prevent sync issues with key stakeholders (global team)
Iterate & test
Testing with actual customers where possible.
Testing with internal (pseudo-customers, i.e. CSMs) customers as a backup
Design in hi-fi and socialise with stakeholders
Test test test - did I mention test?
Deliver for implementation
Writing user stories
Creating handoff specs
Sitting with the engineers to mitigate any potential miscommunications and dramatically reduce double handling.
Support implementation
I made myself available as an approachable subject matter expert for anyone/everyone who had questions.
It was important to keep the lines of communication open between designers and engineers to maintain a level of trust we were working hard to build within the team.


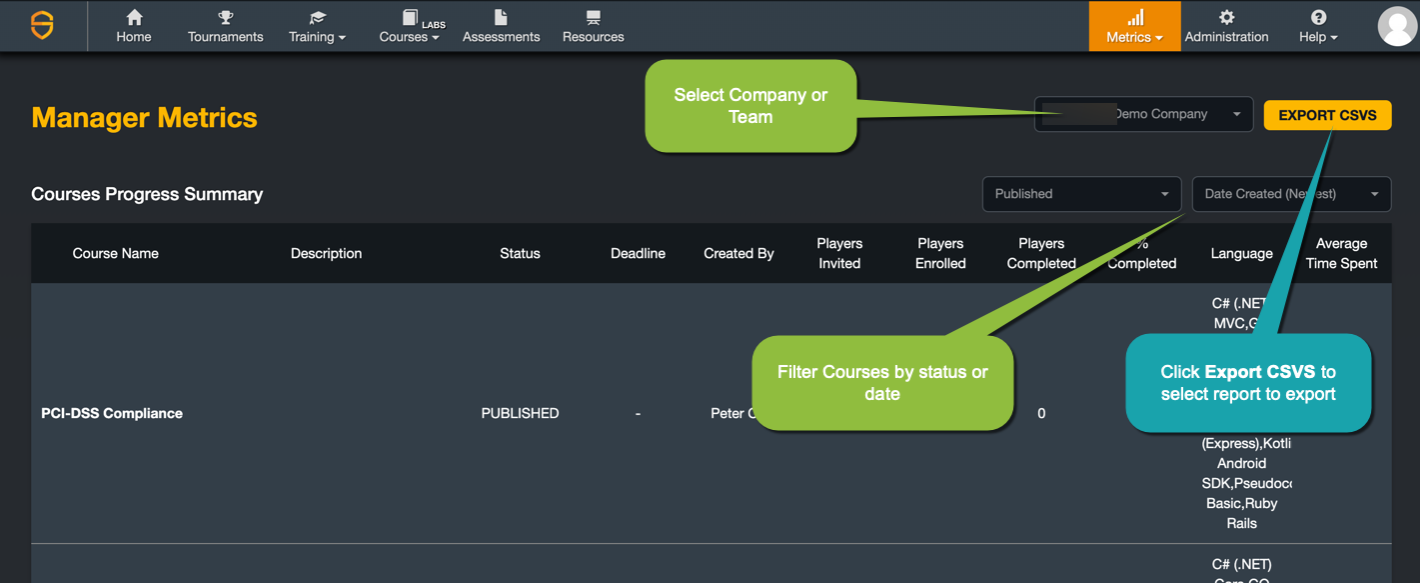
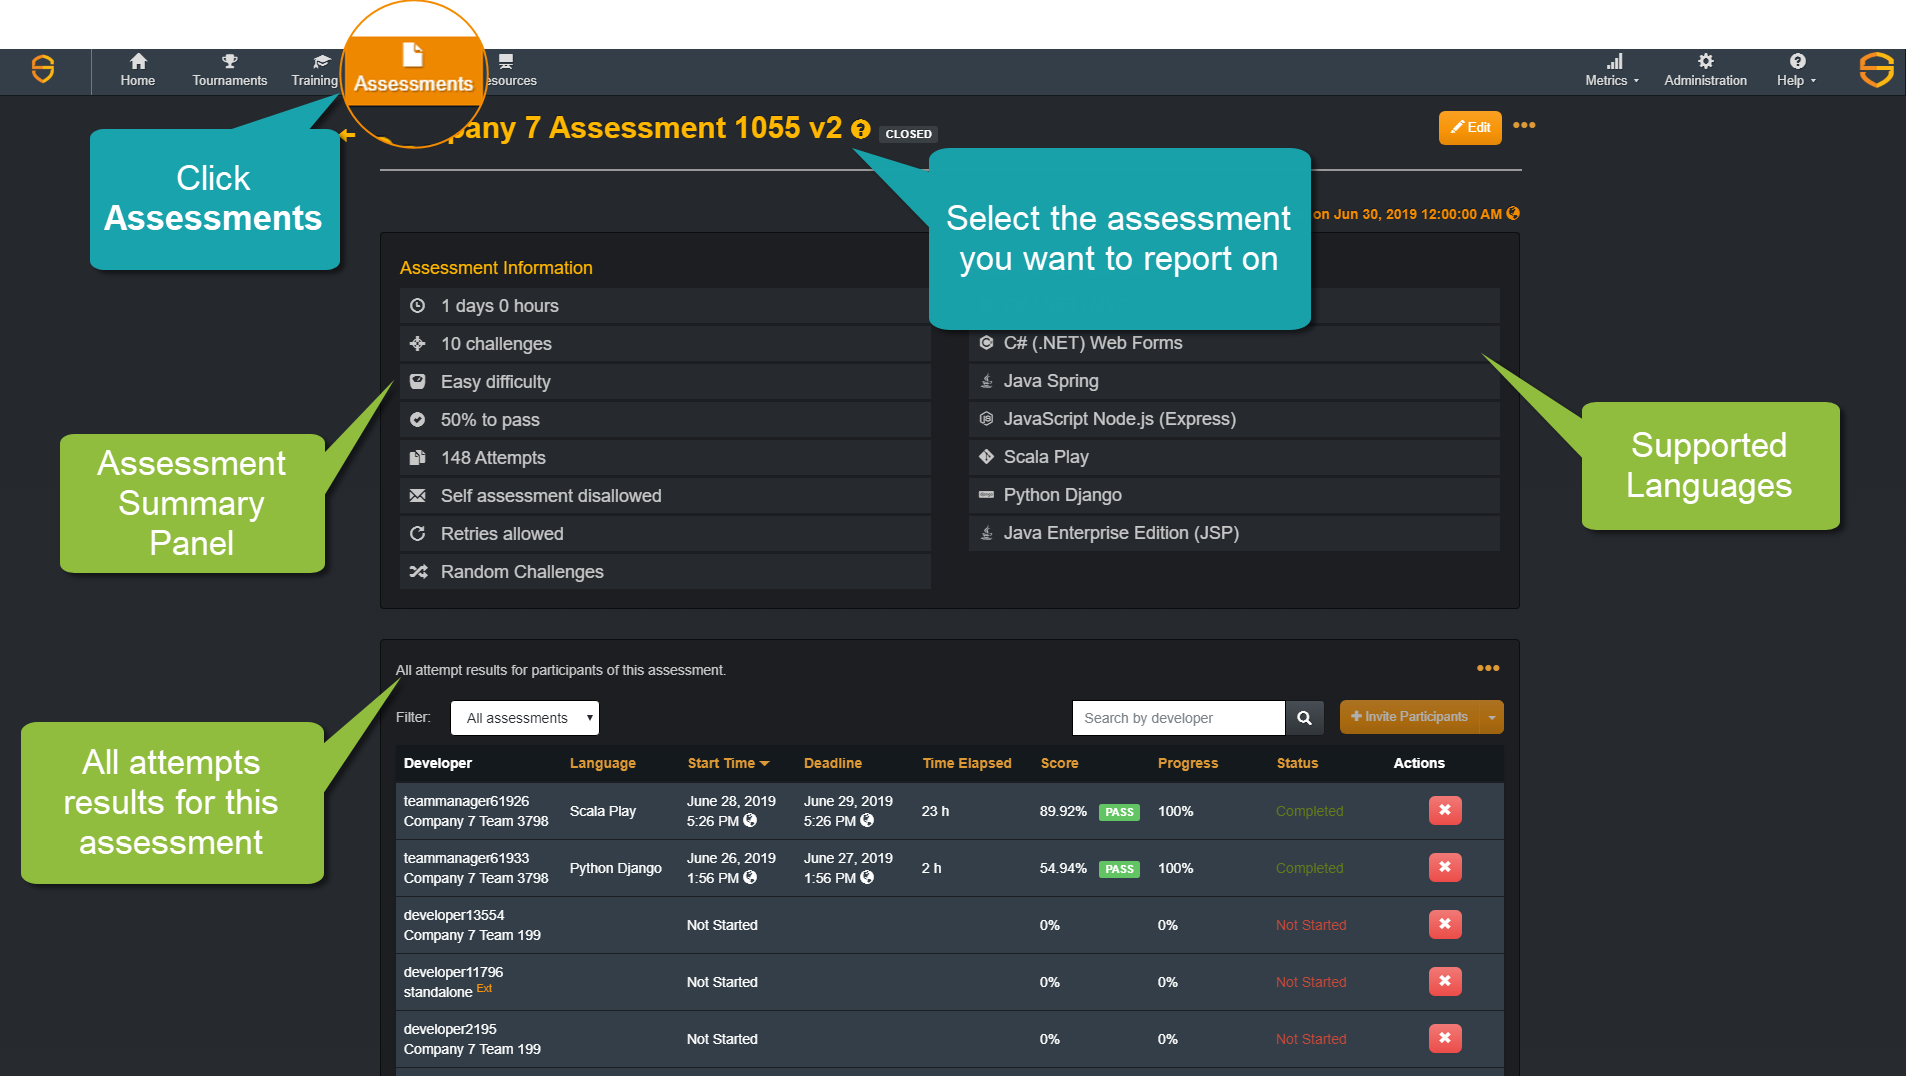
What does reporting look like now?
Spread across both light and dark styling, three different tabs, several pages, a couple of popup modals, and lots and lots of scrolling are our customers platform usage information.
Even then, they are only available as CSV exports - and it is raw data!
Training leaderboards

Courses reports

Assessments reports
Research
SCW is a complex product with a wealth of information so it was overwhelming to consider putting all these pieces into a single location.
Surely there is a way to break this down, say via a hierarchy of user stories from most important reports to least. To do this I needed to understand what were the most important customer requests.
I held ad-hoc contextual inquiry sessions with anyone who had customer insights.
Customer success managers
Sales
Product managers
Customer company administrators
Research findings
Customers were very on edge due to a previous reporting feature being promised and scrapped with no backup.
Current reporting involved customers searching the platform for what they wanted, then downloading a CSV and manually manipulating the information.
OR, CSMs did it on the customer’s behalf.As a workaround a google slide plugin had been developed but it provided inconsistent metrics.
Our key users were Company admins, and their key pain point was identifying those developers who had completed their assigned training (KPI checkboxing, basically).
We gathered a wealth of reporting-related customer feedback within Productboard.
105 companies included
252+ feedback items .
Top 40 companies by revenue (71 feedback items).
All companies with tenure >13 months (17 feedback items).
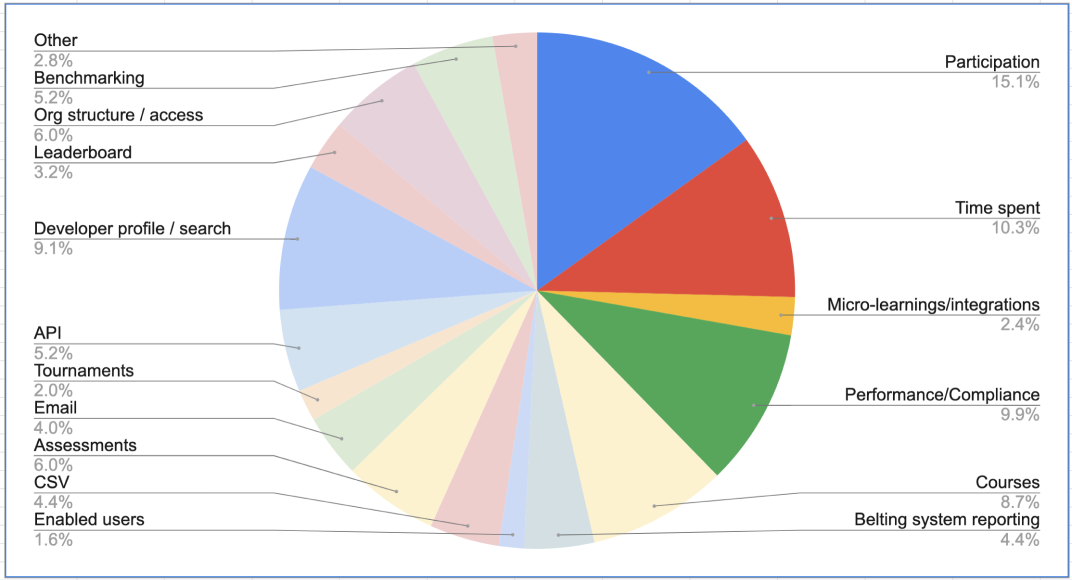
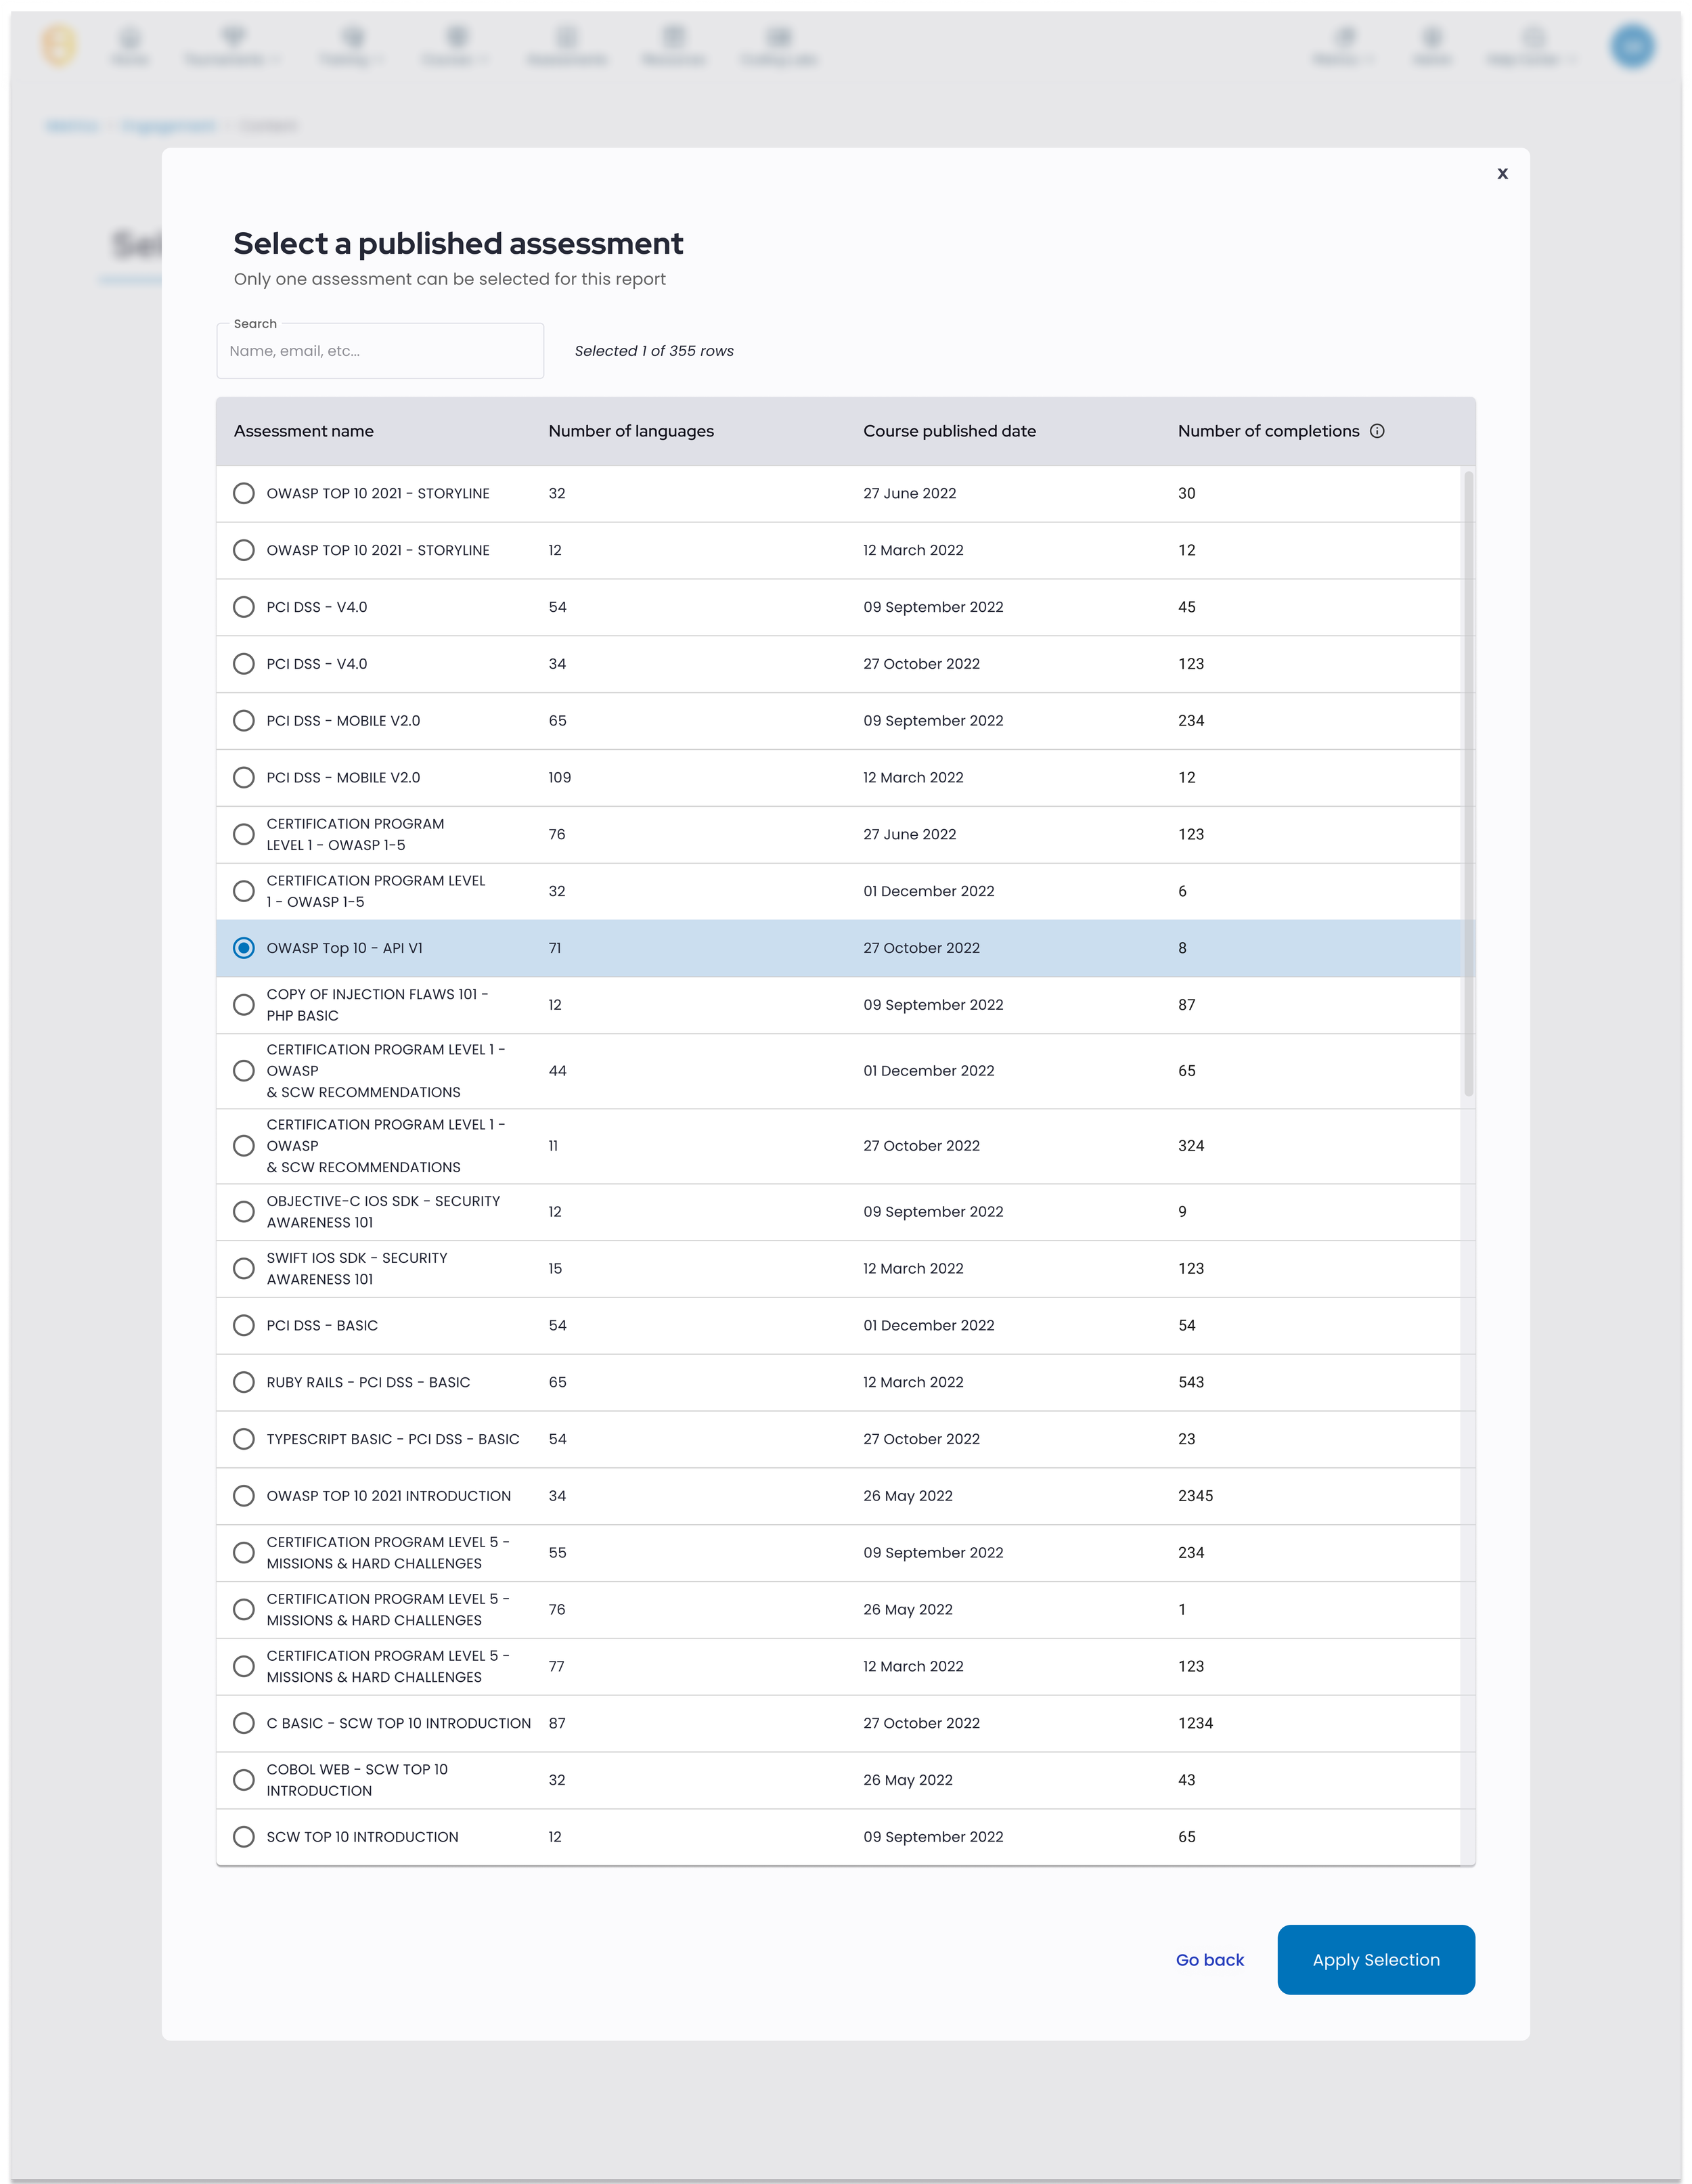
Site map and planning
The majority of the feedback had alot of overlapping information. This allowed us to categorise them into distinct parts, and break them into distinct reports, e.g. Time spent, Participation, Compliance, etc.
These reports were crucial because we now had a hierarchy of information.
Combined with our Productboard information we could establish our backlog.


High level UX goals
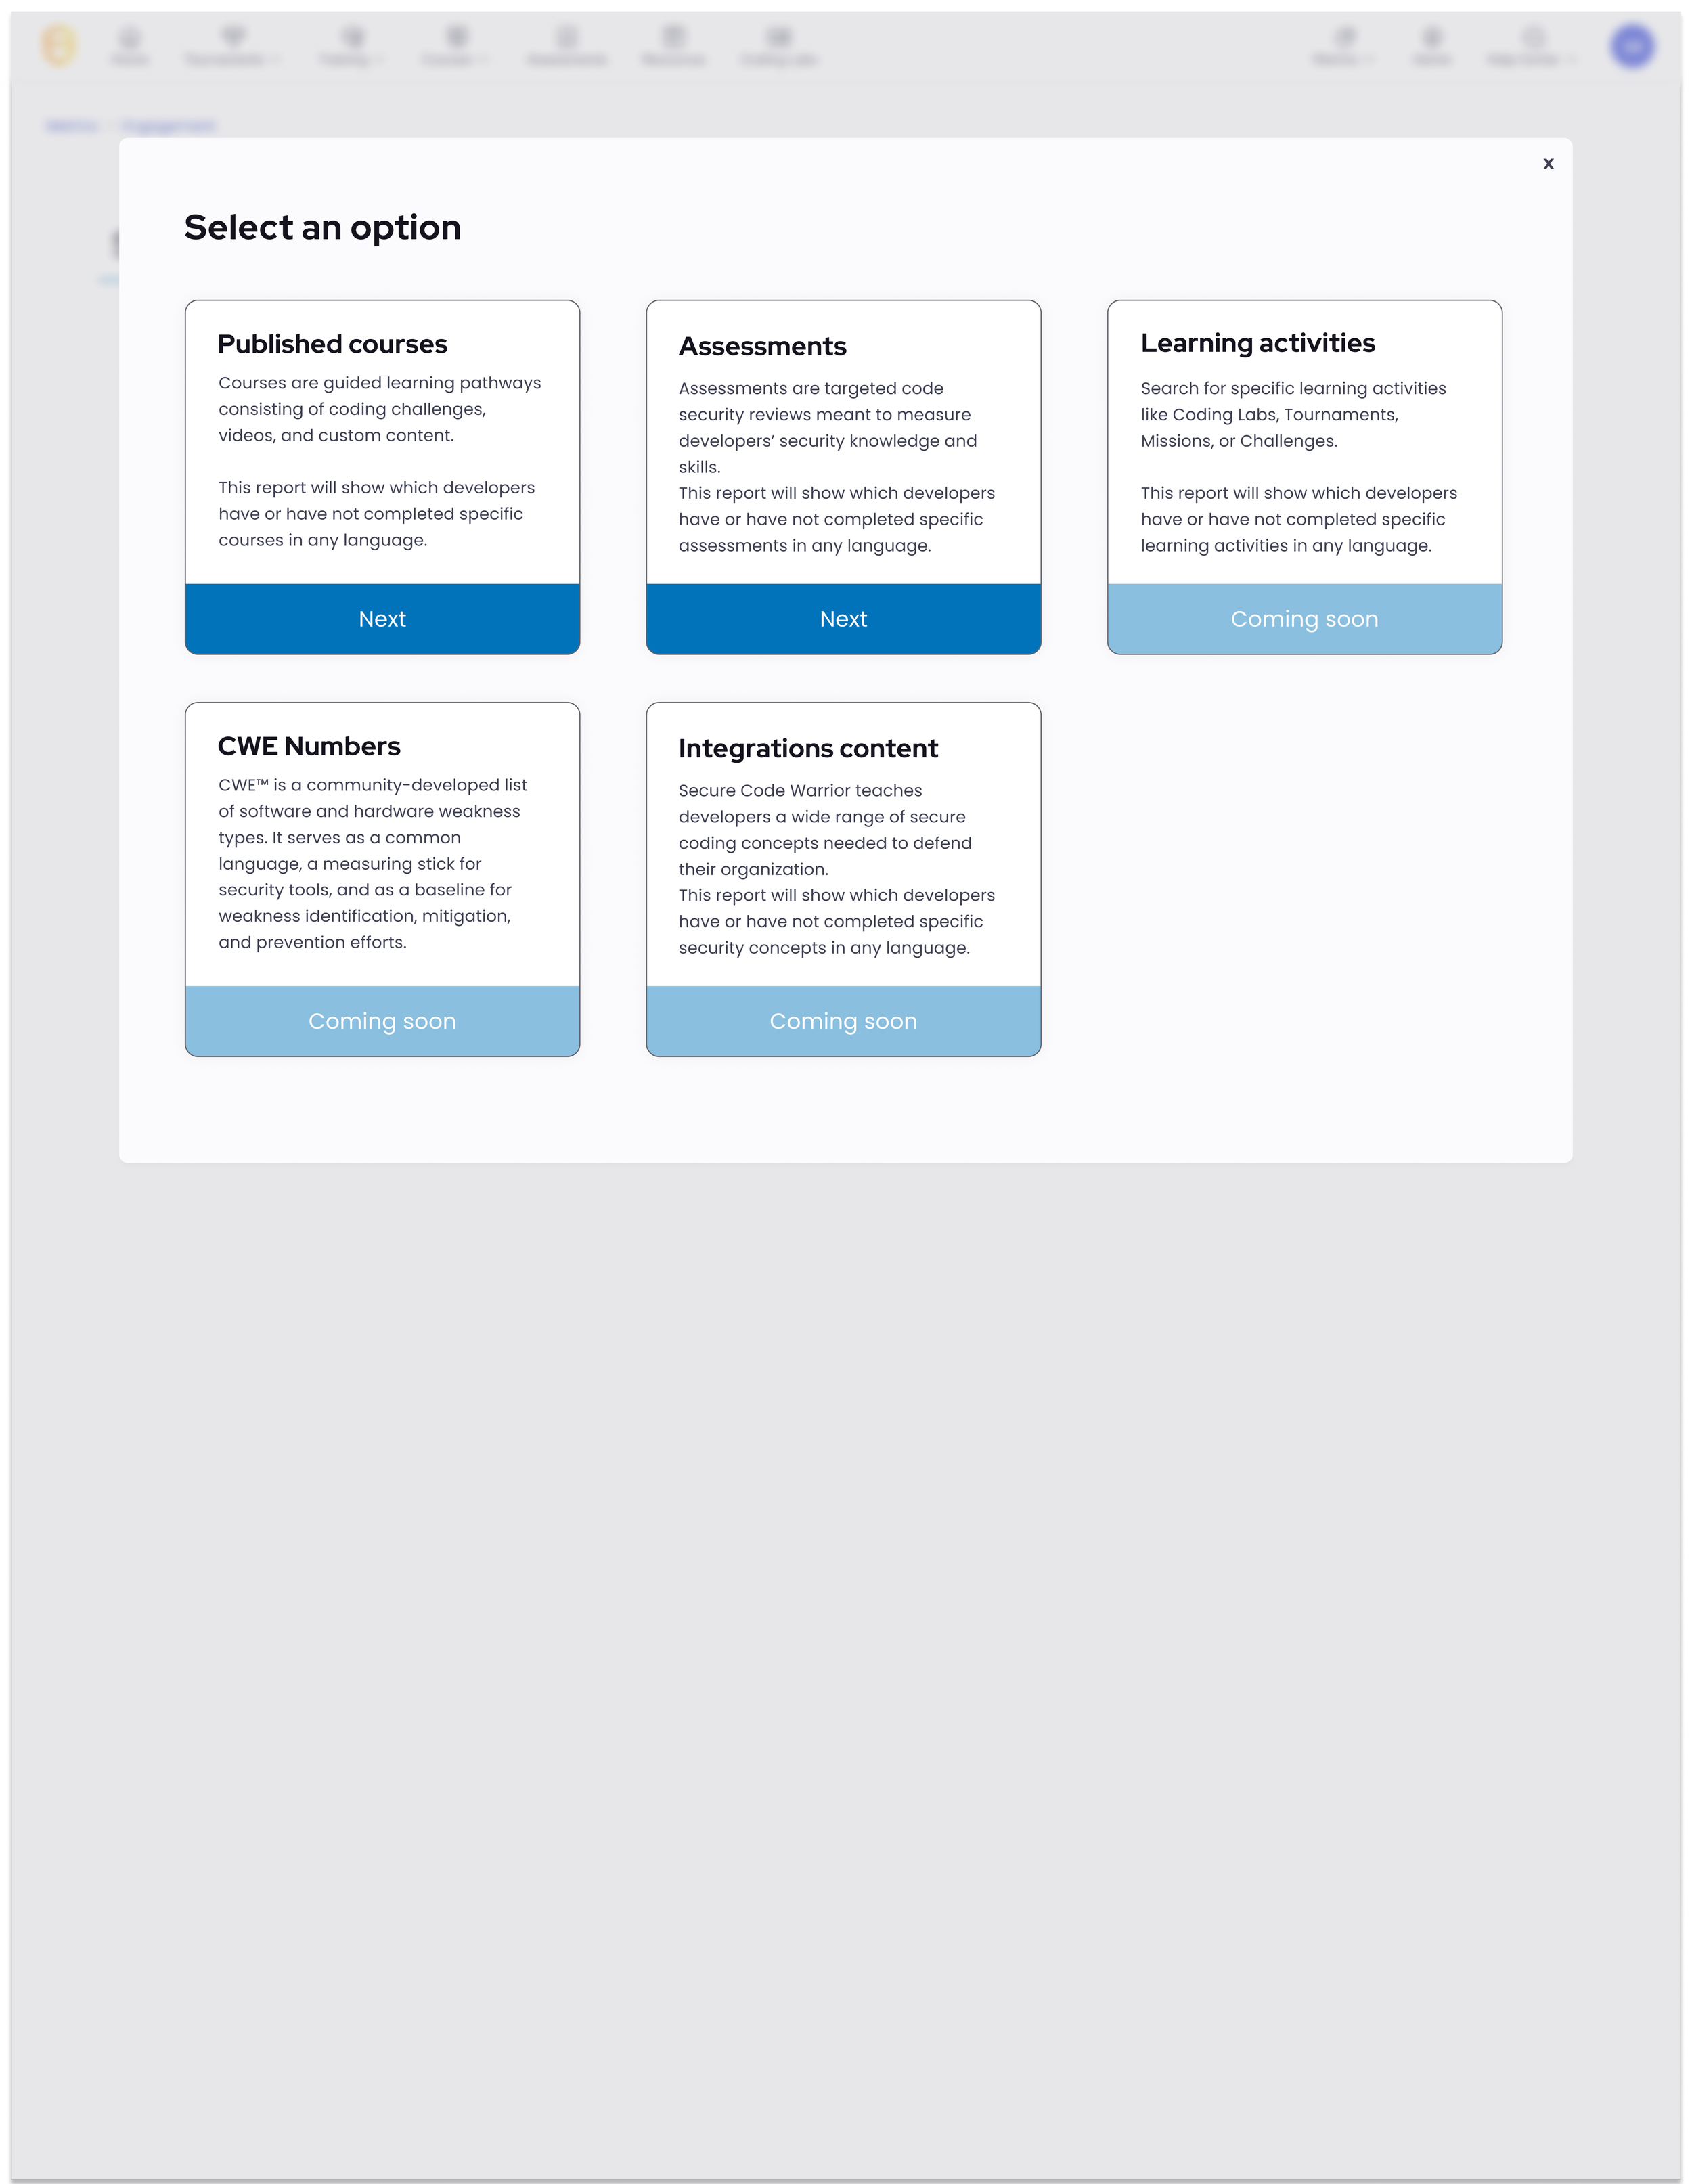
Create a practicle and simple interaction.
Design a solution structure that can cover all report types into the future.
Make information accessible, meaningfully grouped, and easy to understand.
Avoid complication at all costs.
Ensure the system does the heavy lifting for the human.
Create a single repository (a “single source of truth”).
Provide accurate data and concise data analytics.
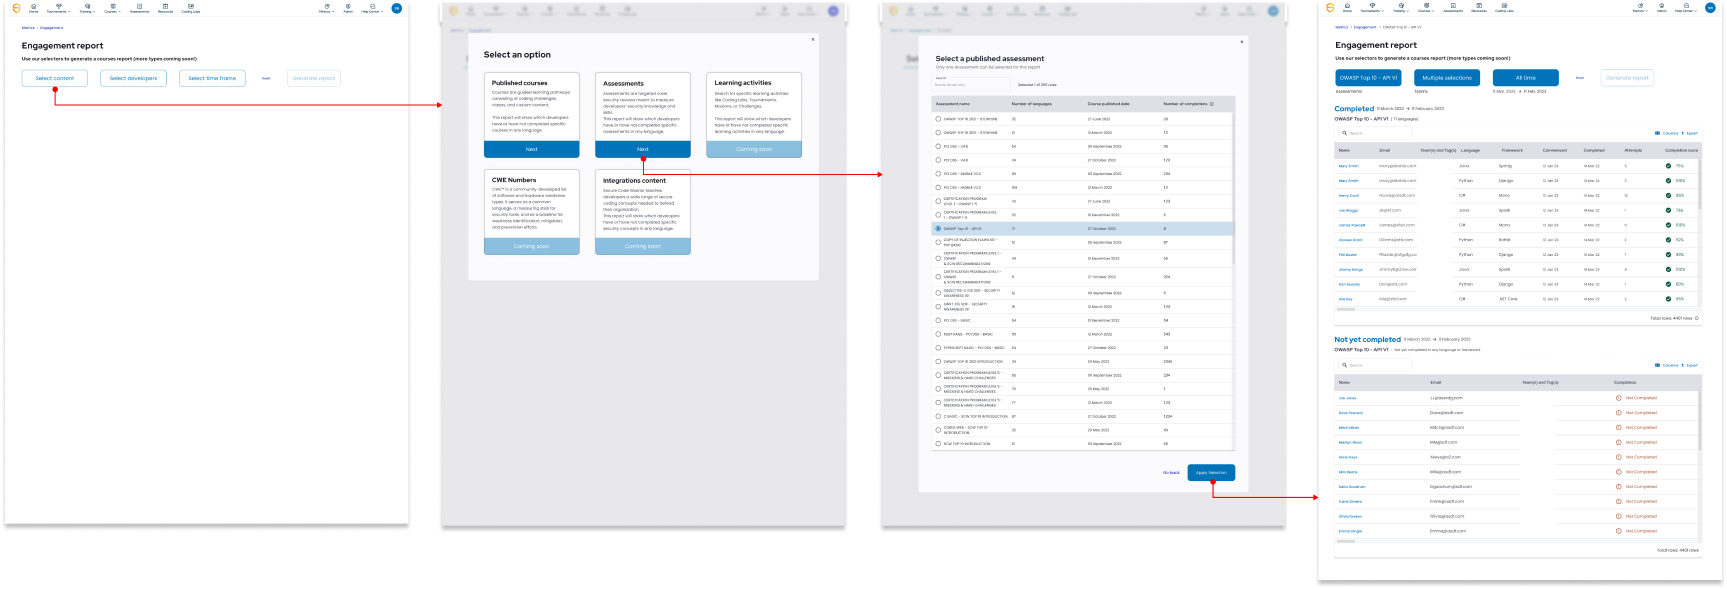
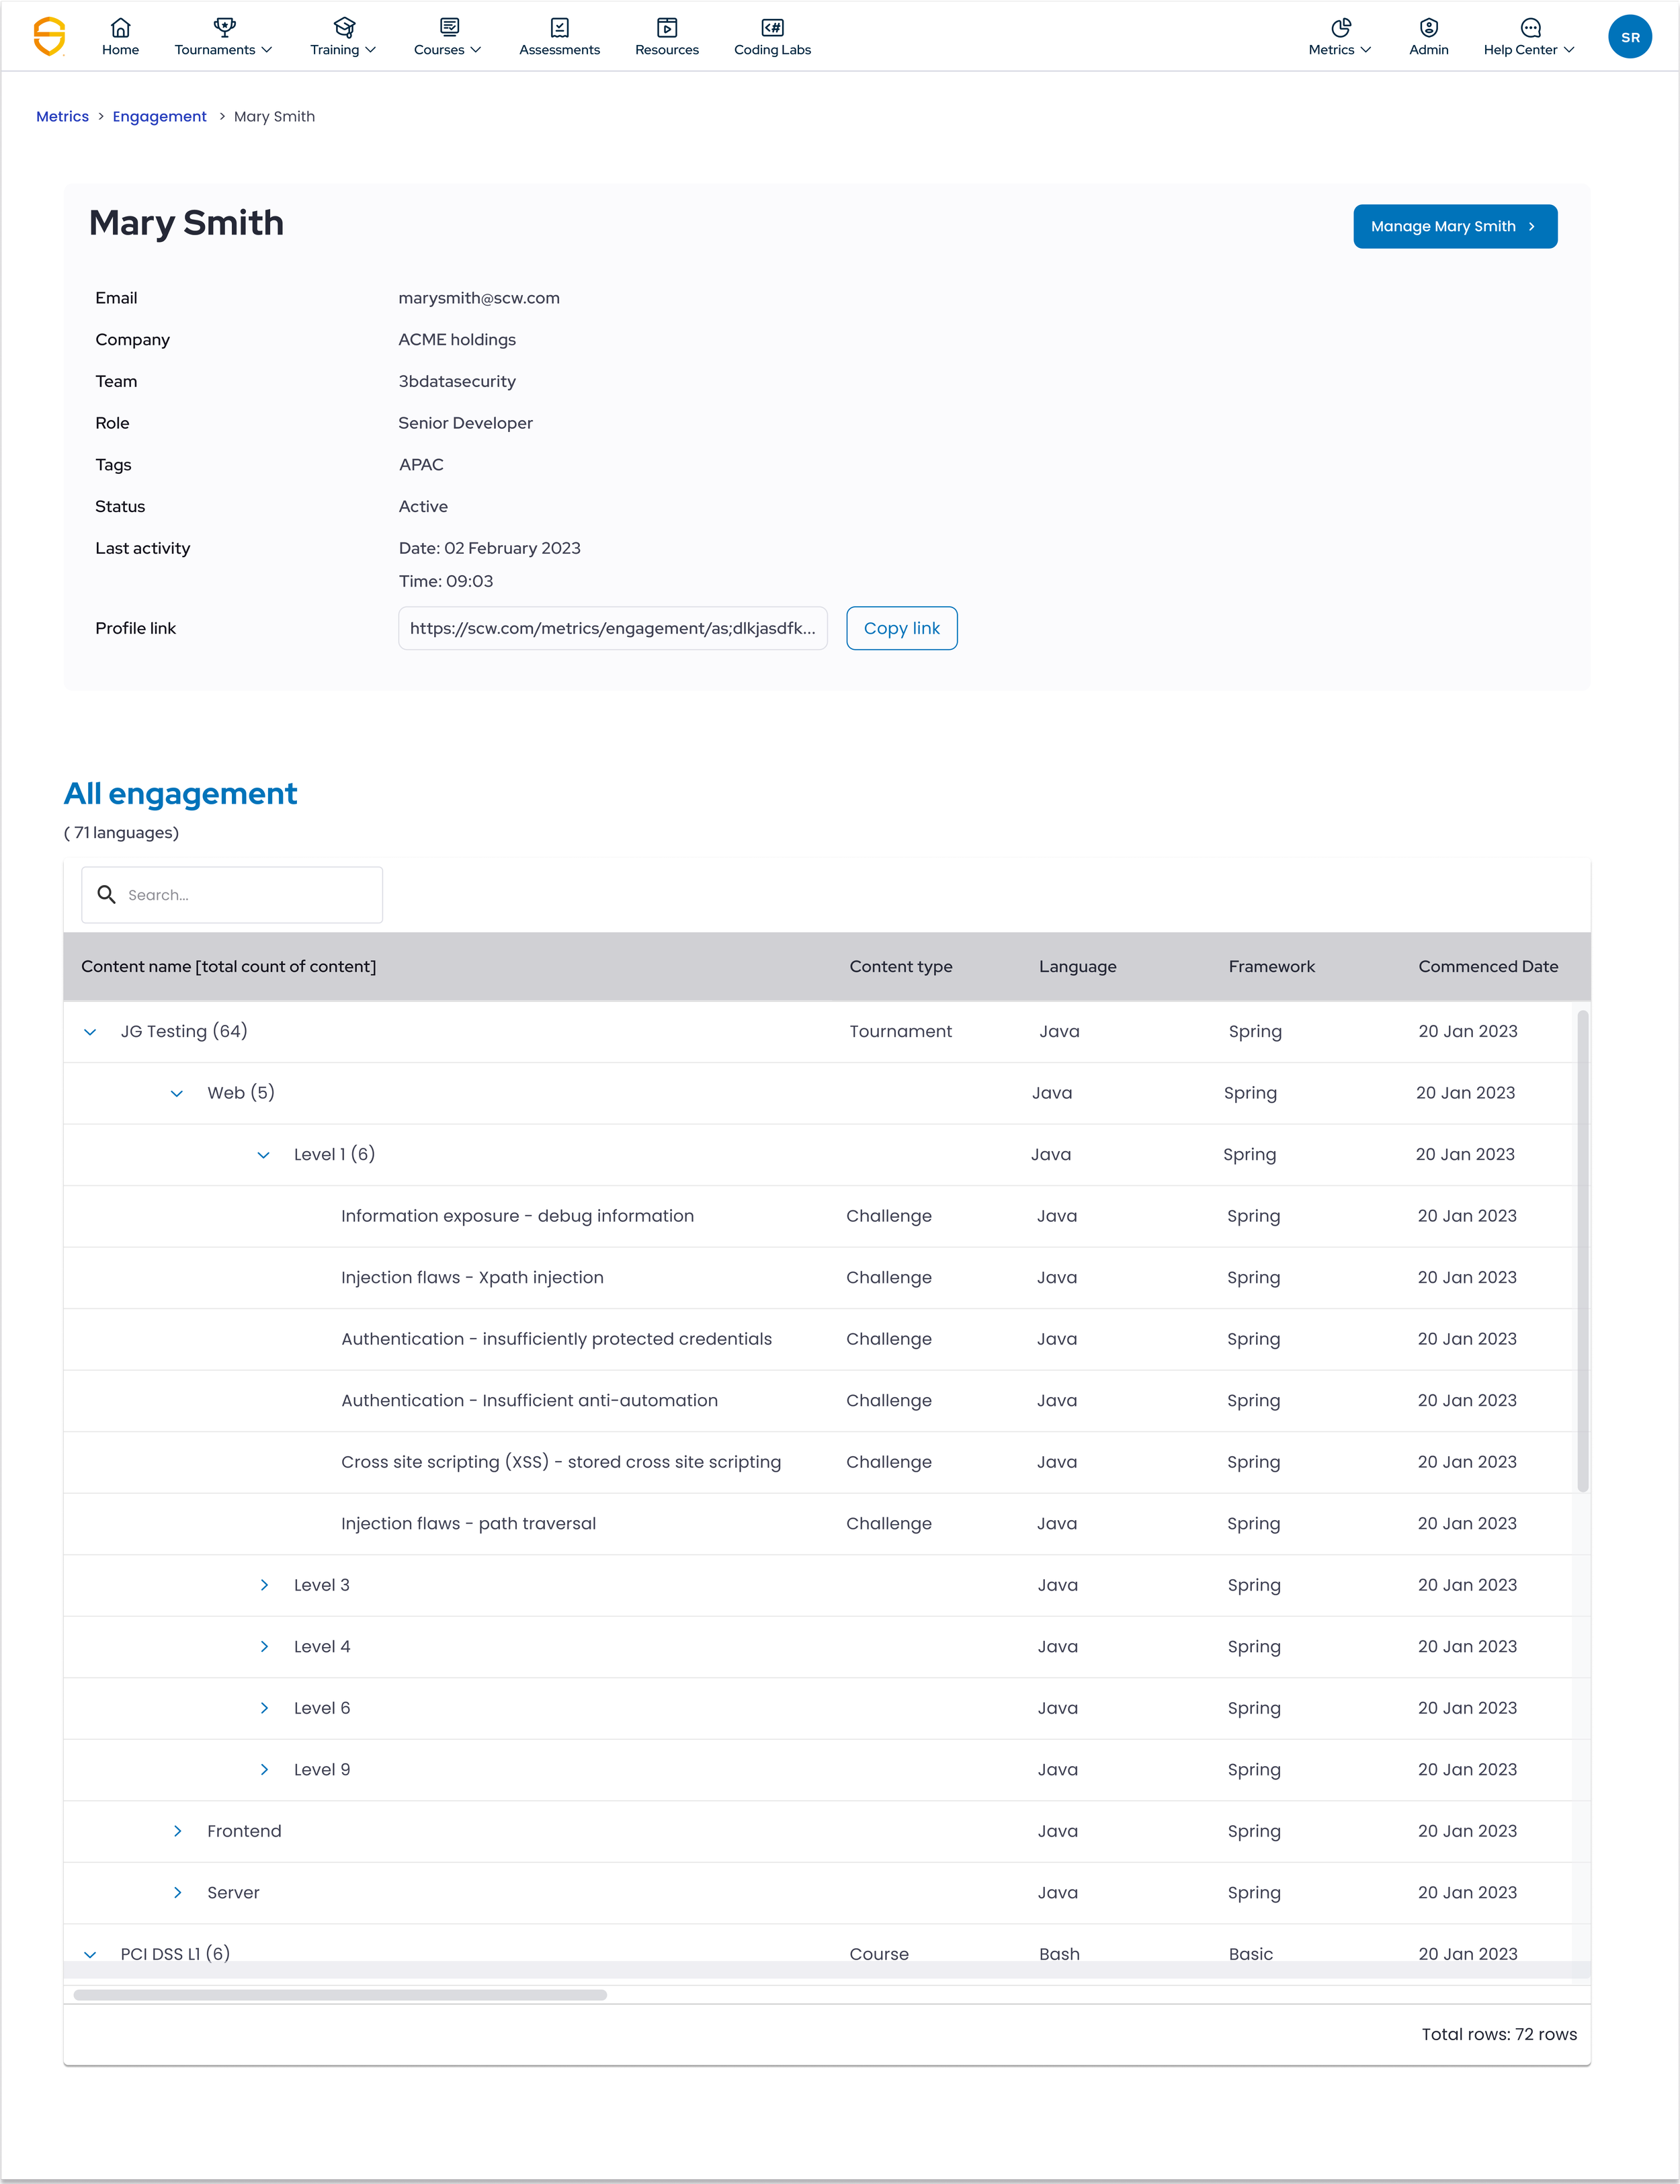
Project outcomes
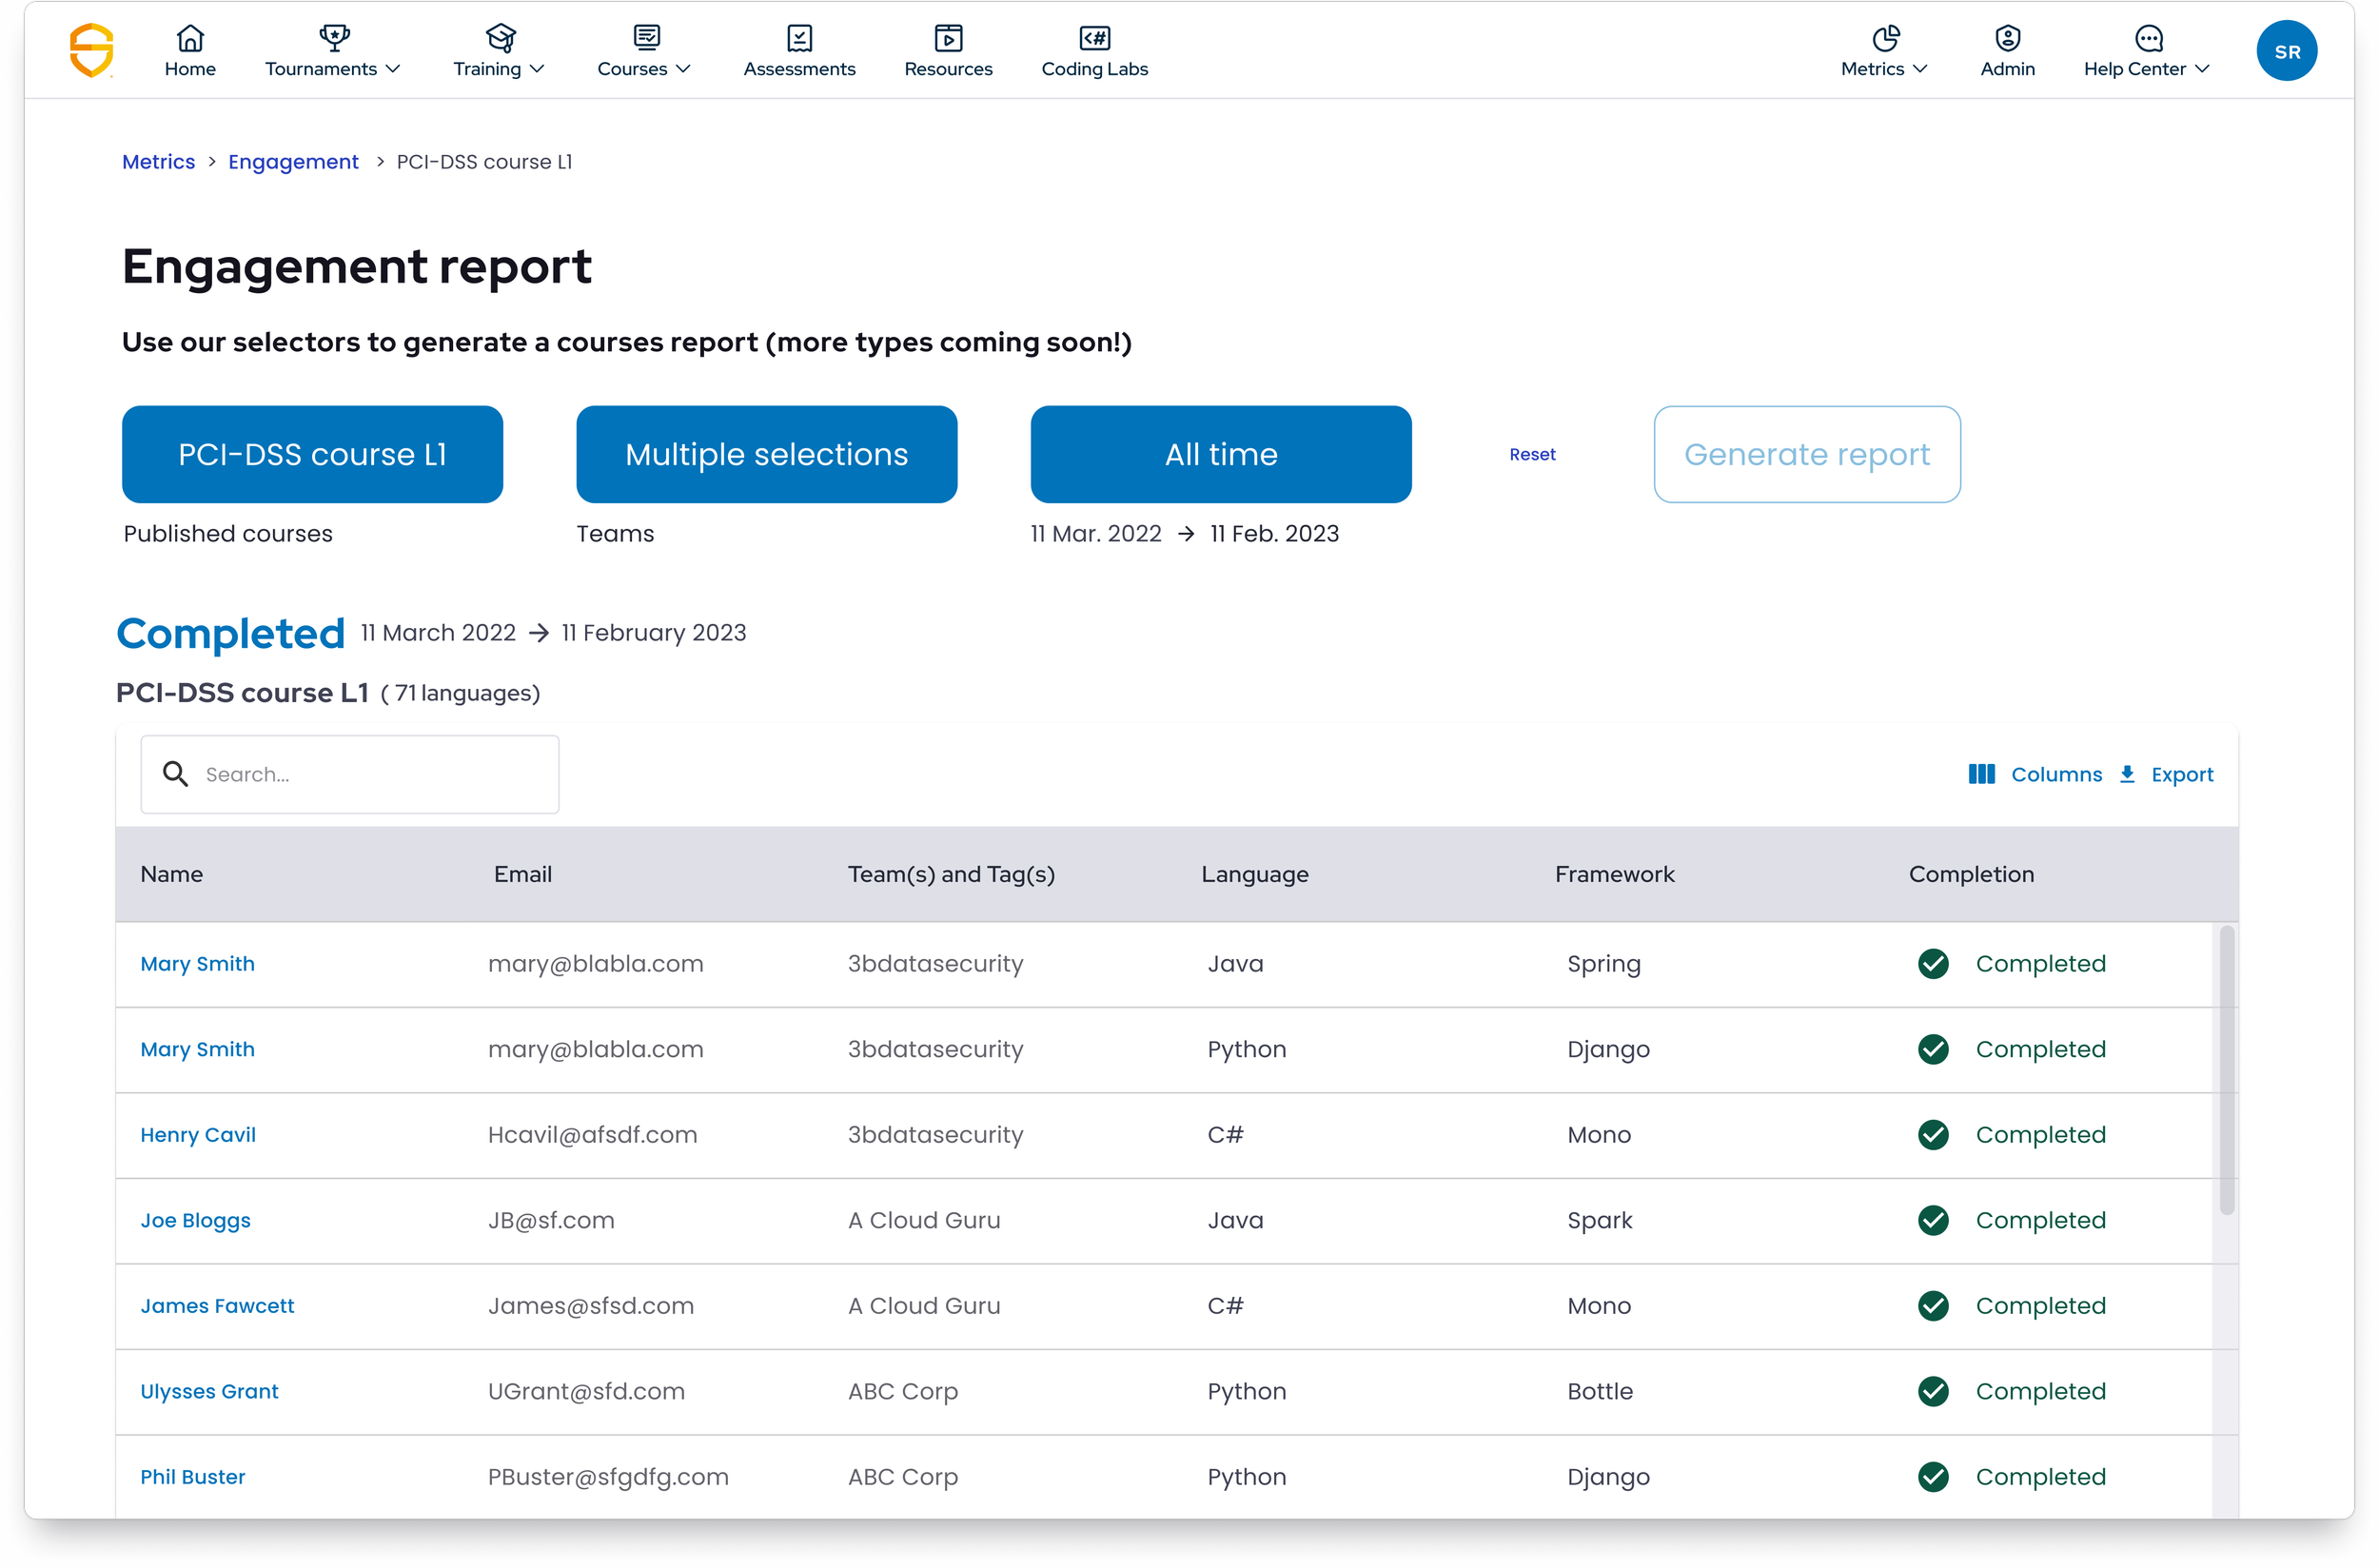
Successfully delivered an easy to use solution that solves customer problems on time.
Complexity in delivery led to reduction in scope. New reports follow a release schedule.
All at-risk customers renewed.
SLT thrilled about new marketable feature.